REA’s Essentials provide quick and easy access to critical information in a variety of different fields, ranging from the most basic to the most advanced. As its name implies, these concise, comprehensive study guides summarize the essentials of the field covered. Essentials are helpful when preparing for exams, doing homework and will remain a lasting reference source for students, teachers, and professionals. Business Statistics I includes descriptive statistics, introduction to probability, probability distributions, sampling and sampling distributions, interval estimation, and hypothesis testing.
- 112 pages
- English
- ePUB (mobile friendly)
- Available on iOS & Android
eBook - ePub
Business Statistics I Essentials
About this book
Trusted by 375,005 students
Access to over 1.5 million titles for a fair monthly price.
Study more efficiently using our study tools.
Information
CHAPTER 1
INTRODUCTION
1.1DEFINITION OF STATISTICS
STATISTICS is defined as the process of collecting, analyzing, interpreting, and presenting data. A distinction should be made between “statistics” as a science or course of study and the term “statistic” which we are accustomed to hearing when listening to the sports news broadcast or the weather report, for example. The term “statistic” is the final outcome (number) which is derived from the science of “statistics” or “statistical methods.”
Statistical methods are categorized as:
a)Descriptive - that body of techniques which describes a set of data in an effort to condense or better understand what is there (e.g., the average age of a group of 100 individuals might give one a much better image of the group as compared to an individual listing of each of the 100 ages).
b)Inferential - that body of techniques which allows us to draw conclusions about a larger group of objects by examining only a portion of those objects (e.g., predicting the outcome of an election by taking a random sample of registered voters).
1.2STATISTICS IN BUSINESS
Statistical data serve as a general aid to the managerial decision making process. One cannot make wise decisions without a proper understanding of the facts used in making those decisions. The most successful decision makers are people who can most effectively make use of the information which is available to them. In some instances, statistical data are collected for a particular purpose, such as a decision on the feasibility of marketing a new product, while in other instances, general information might be sought about economic conditions. Statistical methods are applied to answer questions in all of the major business disciplines including accounting, finance, marketing, economics, production, and of course, general management.
1.3TYPES OF STATISTICAL DATA
DATA are the facts on which we perform statistical methods or techniques; i.e., facts which we collect, analyze, interpret, and present. Data are either:
| a) qualitative - | verbal; e.g., gender, race, class in school, |
or
| b) quantitative - | numerical; e.g., height, weight, age, or score on an exam. |
If data are qualitative, we may analyze them by determining the percentage falling within each category. For example, if we are analyzing information about the gender mix of a group, we may express this either as the total of males and females in the group or the percentage of males and females in the group. Other methods of attempting to “make sense” of this characteristic would yield useless results. On the other hand, the types of analysis that can be performed on quantitative data are much broader and will be the basis for most of the material presented in this book. It should be noted, however, that qualitative data are often coded as numerical data (e.g., male = 1 and female = 2) in order to permit certain forms of quantitative analysis.
1.4SOURCES OF STATISTICAL DATA
Data may be collected from a number of different sources.
Internal Data are facts that are collected from records of the organization desiring the data; e.g., company records such as sales figures, inventory records, payroll information.
External Data are facts that are collected from sources outside the organization desiring the information; i.e., from sources other than company records. These data are published and may be in the form of a:
Primary Source - that which presents data collected and published first hand
or
Secondary Source - that which republishes data taken from a previously published source.
On the other hand, external data may be collected from an original investigation utilizing a survey technique. When this is the case, these data are referred to as Primary Data.
CHAPTER 2
DESCRIPTIVE STATISTICS
2.1FREQUENCY DISTRIBUTIONS AND GRAPHS/CHARTS
A frequency distribution is one method of condensing original data into a more usable form. It is a table which is used to summarize a set of data by showing the number of items contained in the individual categories set forth in the table. A frequency distribution may be constructed using either qualitative or quantitative data. Qualitative data are much easier to tabulate in this manner due to the natural categorization of the data.
a)Qualitative Data
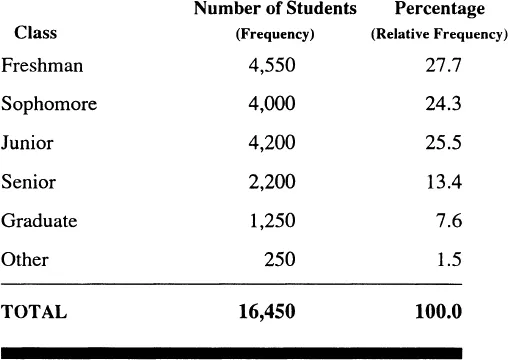
Frequency distributions illustrating qualitative data simply indicate the categories into which the data are to be divided and the number (or percentage) of the objects falling within each category.
EXAMPLE:
FREQUENCY DISTRIBUTION
OF THE NUMBER OF STUDENTS
ENROLLED IN XYZ UNIVERSITY
BROKEN DOWN BY CLASS
1989 – 90
OF THE NUMBER OF STUDENTS
ENROLLED IN XYZ UNIVERSITY
BROKEN DOWN BY CLASS
1989 – 90
Charts or graphs are also meaningful data reduction techniques. The two most appropriate charts for qualitative data are the bar chart/graph and the pie chart.
EXAMPLE:
THE NUMBER OF STUDENTS
ENROLLED IN XYZ UNIVERSITY
BROKEN DOWN BY CLASS
1989 – 90
ENROLLED IN XYZ UNIVERSITY
BROKEN DOWN BY CLASS
1989 – 90
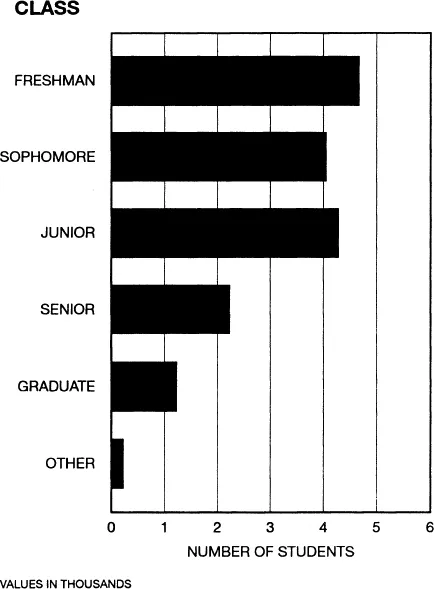
NOTE: It is also appropriate to present this data in a vertical bar chart.
EXAMPLE:
PIE CHART OF THE NUMBER
OF STUDENTS ENROLLED IN XYZ
UNIVERSITY BROKEN DOWN BY CLASS
1989 – 90
OF STUDENTS ENROLLED IN XYZ
UNIVERSITY BROKEN DOWN BY CLASS
1989 – 90
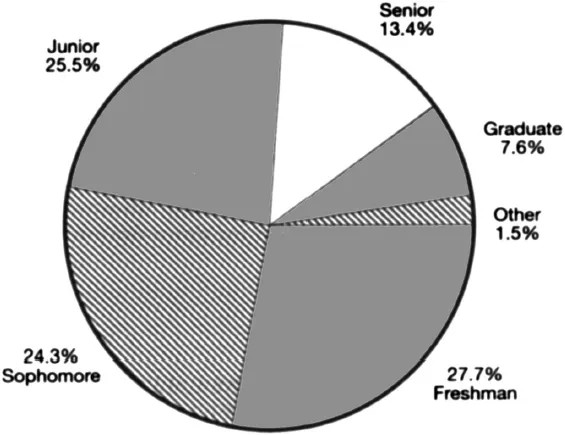
Note that the pie chart expresses the information as a percentage whereas the bar graph typically presents actual count.
b)Quantitative Data
When quantitative data are to be tabulated into frequency distributions, we must determine:
1.The number of non-overlapping classes required for the quantity of data bei...
Table of contents
- Cover
- Title page
- Copyright Page
- Contents
- 1 Introduction
- 2 Descriptive Statistics
- 3 Introduction to Probability
- 4 Probability Distributions
- 5 Sampling and Sampling Distributions
- 6 Interval Estimation
- 7 Hypothesis Testing
- Appendix
Frequently asked questions
Yes, you can cancel anytime from the Subscription tab in your account settings on the Perlego website. Your subscription will stay active until the end of your current billing period. Learn how to cancel your subscription
No, books cannot be downloaded as external files, such as PDFs, for use outside of Perlego. However, you can download books within the Perlego app for offline reading on mobile or tablet. Learn how to download books offline
Perlego offers two plans: Essential and Complete
- Essential is ideal for learners and professionals who enjoy exploring a wide range of subjects. Access the Essential Library with 800,000+ trusted titles and best-sellers across business, personal growth, and the humanities. Includes unlimited reading time and Standard Read Aloud voice.
- Complete: Perfect for advanced learners and researchers needing full, unrestricted access. Unlock 1.5M+ books across hundreds of subjects, including academic and specialized titles. The Complete Plan also includes advanced features like Premium Read Aloud and Research Assistant.
We are an online textbook subscription service, where you can get access to an entire online library for less than the price of a single book per month. With over 1.5 million books across 990+ topics, we’ve got you covered! Learn about our mission
Look out for the read-aloud symbol on your next book to see if you can listen to it. The read-aloud tool reads text aloud for you, highlighting the text as it is being read. You can pause it, speed it up and slow it down. Learn more about Read Aloud
Yes! You can use the Perlego app on both iOS and Android devices to read anytime, anywhere — even offline. Perfect for commutes or when you’re on the go.
Please note we cannot support devices running on iOS 13 and Android 7 or earlier. Learn more about using the app
Please note we cannot support devices running on iOS 13 and Android 7 or earlier. Learn more about using the app
Yes, you can access Business Statistics I Essentials by Louise Clark in PDF and/or ePUB format, as well as other popular books in Volkswirtschaftslehre & Statistik für Volks- & Betriebswirtschaft. We have over 1.5 million books available in our catalogue for you to explore.