What sorts of people are passionately concerned about human rights?
A few years ago, a human rights charity commissioned an analysis of the 235,000 adults on its supporter file. Had a civil servant and not a human rights charity commissioned the analysis, or had it been a social scientist attached to a university who delivered it, the most likely output would have been a series of tables in a format similar to Tables 1.1 and 1.2.
But this was not how the analysis was conducted; instead a very different mode of analysis was used, one that has come to be known as geodemographic profiling. Instead it was a table in a format similar to Table 1.3 that appeared at the heart of the analysis.
So, what do the various columns of Table 1.3 indicate? Let us start with the categories listed in column A. These are known as Mosaic Types.1 They do not describe supporters in terms of any personal characteristics, but rather according to the types of people most likely to live in the same streets as they do. Each has a code which is organized sequentially, 01–61, within a hierarchic structure, A–K.
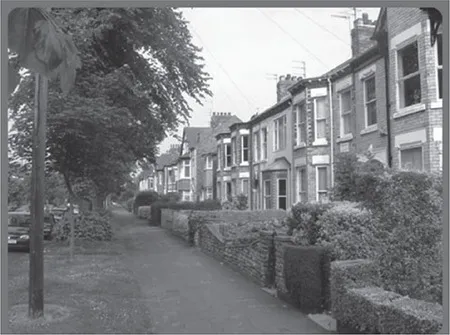
Next to these Mosaic Types and their associated codes in column B we see the numbers of UK adults living in each Type at the time of the analysis – in total some 46,336,087. So, for example, 366,079 adults live in the geodemographic Type E31, labelled Caring Professionals.2 This happens to be 0.79 per cent of UK adults. Column C reveals how the 235,358 supporters of the human rights charity are distributed across these same categories. So, we see that 9,858 of their supporters, which happens to be 4.19 per cent of the total, are classified as living among neighbours characterized as Caring Professionals. Figure 1.1 shows a street typical of that Type.
Column D is a simple index comparing the percentage of supporters who live in each Mosaic Type with the percentage of the national adult population; so, in the case of Caring Professionals, the index of 530 is obtained when the 4.19 per cent of supporters is divided by the 0.79 per cent of adults and multiplied by 100. The higher this index value, the greater is the likelihood that a resident living in this geodemographic type will be a supporter of the charity. In this example, the figure of 530 indicates that Caring Professionals are some 5.3 times more likely to be supporters of the charity than the national average. That is a substantial difference. It is the highest of any of the 61 Types.
Mosaic is an example of what is known as a geodemographic or neighbourhood classification system. There are three features of this form of analysis which warrant particular attention at this point. In terms of operational efficiency, the feature which most distinguishes a geodemographic profile is how easy it to produce tables such as Table 1.3. All that it requires is for the charity to know the postcodes of their supporters. No survey questions need to be asked, no responses processed (Savage and Burrows, 2007; 2009).
Figure 1.1 Mosaic E31 Caring Professionals, Park Avenue, Hull, HU5 3ER
In terms of social theory, the feature which most distinguishes a geodemographic profile is that it categorizes people not on the basis of their own personal characteristics, such as age, gender, ethnicity and so on, but on their geographical location, that is, according to the characteristics of their immediate neighbours.3 Notwithstanding the variety of age groups, genders, ethnic groups and, in particular, social classes,4 who live next door to each other in the same type of postcode, this form of classification often proves just as predictive of people’s behaviour as does information held at the person level. This gives powerful support to the belief that personal behaviour continues to be hugely influenced by social norms at the local level, even in the era of social media.
In terms of statistical methods, the feature that distinguishes a geodemographic profile is that it uses what are referred to as multivariate categories. Geodemographic categories are multivariate in that the set of variables used to construct them typically represents different dimensions of social character. This is by contrast with social surveys where customer or client behaviour is typically cross-tabulated against a series of separate univariate categories such as age, as in the case of Table 1.1, or the measure of social class used in Table 1.2. Clearly the definition of a multivariate category such as K57 Summer Playgrounds, is more complex than the definition of a univariate category such as persons aged over 65. But it does not necessary follow that multivariate categories are any more difficult to interpret than ones built using data representing a single dimension.
When they see a table such as Table 1.3 for the first time, some readers may question how appropriate it is to use a label such as G41 Families on Benefits to describe a particular geodemographic type. Others ask on the basis of what evidence can it be possible to justify a label such as B13 Burdened Optimists. How literally can a concept such as D24 Coronation Street be taken, some may ask?5 And where can they find the information they need to understand the meaning of Caring Professionals?
Other people question whether it is appropriate for public servants to be making use of categories that have been developed for use by commercial organizations. Others fear that if such classifications are the intellectual property of commercial organizations this may limit their use in social scientific research. All these critical questions are ones we address in the chapters that follow.
Moving from the format of Table 1.3 to its substantive implications, perhaps the most striking is how strongly the level of support for the charity varies between one geodemographic type and another. It may be intellectually reassuring to learn that the most fertile neighbourhood type for the charity is labelled Caring Professionals. But is the scale of these geographical differences greater or less than the differences in the degree to which the charity appeals to different social classes? How far is this concentration the result of social pressures, ‘peer’ or ‘neighbourhood’ effects in the language of the social sciences? Is it the distinctive social values of its residents that cause the charity to pick up so many supporters among Caring Professionals; perhaps this is the reason why residents in these types of postcode are so especially receptive to the campaign for human rights? Or are supporters clustered geographically because Caring Professionals are disproportionately found in university towns where there is likely to be a thriving local group?
At a more fundamental level we could ask what are the social and political dynamics that have caused the issue of human rights to resonate so deeply with residents in the neighbourhoods characterized by Symbols of Success (the term that is given to the Types in Group A), see Table 5.4 on pp. 114–15 for more details, and to those in Urban Intelligence (the term that is given to Group E)? Maybe the emotions of residents in categories in Group B, Happy Families, are so invested in the care of their young children that they can’t be persuaded to focus on the wider issue of human rights. If Labour-leaning categories in Groups G and H show so little concern for human rights, whereas Labour-leaning categories belonging to Urban Intelligence are so exercised by them, what does this contribute to our understanding of the tensions that divide different groups within the Labour Party for example? There are so many questions of this sort that can arise from a detailed examination of the variations in the index values of the different Mosaic Types.
At about the same time as this analysis was being carried out, someone leaked the names and addresses of members of a far-right political party. Columns E and F of Table 1.3 chart the distribution of the party’s 10,652 members across the same geodemographic types. It is not surprising that the geodemographic types the party draws its support from are very different to those of the human rights charity. Its most fertile recruiting areas are neighbourhoods classified as D24 Coronation Street, D22 Affluent Blue Collar, D23 Industrial Grit and H46 White Van Culture.6 The likelihood of a person being a party member exceeds the national average by more than 40 per cent in each of these categories.
Tables 1.4 and 1.5 illustrate another commonly used form of geodemographic analysis. The object of an analysis of this sort is to provide broader insight into the lifestyles of particular groups of people, in this case the supporters of the far-right party. Table 1.4 is produced by comparing the geodemographic profile of party members with the profiles of a large number of other behaviours held in what is referred to as a profile library, a concept which is explained in greater detail in Chapter 6. From the many hundreds of demographics and behaviours that have been profiled by Mosaic this table reveals the ones which are the most positively associated with the types of neighbourhood in which support for this far-right party is especially concentrated.7
It would interest few readers to learn that employment in lower supervisory occupations and readership of mid-market newspapers were the most distinctive characteristics of the types of neighbourhood where the party finds it easiest to recruit supporters. More interesting but less obvious is that its members tend to live in the types of neighbourhood where people like going camping and caravanning. What might we learn from this? Is it that this form of holiday and the far-right party both appeal to a similar group of people, characterized by a strong sense of self-reliance and a dislike of externally imposed controls? Or do they both appeal to patriotic people with little enthusiasm for exploring foreign cultures? Maybe both explanations for the association are valid.
Much more revealing are those behaviours that are most negatively associated with people living in the types of neighbourhood where supporters of the far-right party are most numerous. Table 1.5 reveals that the two strongest negative associations are with making international phone calls once per week or more and with households containing adults from two or more ethnic groups. Party supporters, or their neighbours, are also among the least willing to support third world, disaster relief or human rights charities. Maybe such relationships are too predictable to be of any real value, but at least they confirm the ability of geodemographics to identify behaviours which ‘go together’ even where these data are held on databases which have never been physically linked.
We decided to introduce this chapter with these two practical examples in order to demonstrate the key proposition of this book. It is that the value of geography as a framework for analysing social behaviour is not limited to its ability to reveal the physical location of citizens or customers. It also has the capacity to deliver a deep sociological understanding of the social groups that engage in particular behaviours. Indeed, by virtue of their multivariate nature, some might claim that this is because the social character of the categories that are encoded within a geodemographic classification, such as Caring Professionals, are so much more nuanced than the relatively crude constructs that feature in the stub section of a survey questionnaire.
For example, the profile of the charity’s supporters is the first of many in this book which will demonstrate the ability of geodemographics to illuminate not just the growing divide between the core values of the metropolitan liberal elite and the conservative working class, but also the cities and parts of cities where these contrasting groups tend to live. A good indication of the depth of this divide can be seen in the ‘Liberal/far-right index’ contained in column G of Table 1.3. Here the ind...