Understanding statistical concepts is essential for social work professionals. It is key to understanding research and reaching evidence-based decisions in your own practice—but that is only the beginning. If you understand statistics, you can determine the best interventions for your clients. You can use new tools to monitor and evaluate the progress of your client or team. You can recognize biased systems masked by complex models and the appearance of scientific neutrality. For social workers, statistics are not just math, they are a critical practice tool.
This concise and approachable introduction to statistics limits its coverage to the concepts most relevant to social workers. Statistics in Social Work guides students through concepts and procedures from descriptive statistics and correlation to hypothesis testing and inferential statistics. Besides presenting key concepts, it focuses on real-world examples that students will encounter in a social work practice. Using concrete illustrations from a variety of potential concentrations and populations, Amy Batchelor creates clear connections between theory and practice—and demonstrates the important contributions statistics can make to evidence-based and rigorous social work practice.
- English
- ePUB (mobile friendly)
- Available on iOS & Android
eBook - ePub
About this book
Trusted by 375,005 students
Access to over 1.5 million titles for a fair monthly price.
Study more efficiently using our study tools.
Information
Subtopic
Education Theory & PracticeIndex
Social Sciences1
INTRODUCTION
This text is written for students studying social work, with the goal of introducing important statistical concepts and tying them to the work that social workers do.
You will use statistics to help make decisions when there is uncertainty. Using observable data, statistics can help summarize and interpret what you see. When what you see is only a part of a larger whole—a sample from a population—statistics will allow you to generalize your results to the larger population.
Within the subject of statistics, understanding variables—how to track them, how they may be limited, and how their limitations affect analyses using those variables—will illuminate your own work. Understanding variables will allow you to share information about your work through a common language of statistics.
The proper use of statistics can ensure you are using evidence-based practices. Evidence-based practice has been described by the National Association of Social Workers (NASW) as “creating an answerable question based on a client or organizational need, locating the best available evidence to answer the question, evaluating the quality of the evidence as well as its applicability, applying the evidence, and evaluating the effectiveness and efficiency of the solution.” To understand the evidence available and evaluate its quality, you must understand statistics. Statistics can help you vet which policies are likely to work. By collecting and using data about the populations you serve, you can use statistics to draw accurate conclusions about the efficacy of interventions or treatments. This text will give you the tools you need to understand and carry out this type of analysis.
Understanding statistics is necessary if you are to be a vigilant consumer of information, both for yourself and for your clients. Data analysis is used in everything from deciding whether someone can receive a loan to what sentence someone may receive when convicted of a crime. Therefore, social workers, especially those who work with marginalized populations, must understand how data and statistics are being used in order to be better advocates for their clients.
Even if you understand the importance of learning statistics, the language of mathematics may seem foreign and intimidating. This text will provide you with the basic statistical tools to be successful. Concepts will be described using straightforward explanations and examples that are relevant to social work. These concepts will also provide a foundation for further study in research methods and data analysis. This text is not exhaustive. It does not cover many statistical concepts found in traditional statistics courses. Instead, it focuses on applying concepts that are most useful in the context of social work.
Throughout the text, you will find examples of situations and data that are particularly relevant to social work professionals. These examples are based on direct practice working with different populations, designing or administrating social programs, and working on policy at the local, state, or federal level.
WHAT DOES THIS BOOK COVER?
The book begins with descriptive statistics. Descriptive statistics can helpfully summarize data to highlight trends that are not clear when looking at individual data points or a data table. Using descriptive statistics, you can go from a list of clients with individual scores on a measure for depression to an average score across all the clients in your caseload. You can break down a list of clients by percentages. Knowing that 80 percent of your clients are female may be more useful than just looking at a list of all your clients’ names. Descriptive statistics include percentages, levels of measurement, frequencies, distributions, measures of central tendency, and variance. These tools allow you to describe a sample or a population with just a few key figures and to summarize data without pages of notes describing each individual’s experience.
The next topic is correlation. Understanding correlation will help you understand the relationship between variables. “Variables” may seem like a term that does not apply to your work, but it does. Simply think of variables as inputs and outputs. For example, you might hope that by increasing the number of counseling sessions a client attends (the input, which we will call variable X) you will have an effect on your client’s reported happiness (the output, which we will call variable Y). Understanding how variables X and Y are related is at the heart of your practice—and at the heart of correlational statistics.
After correlation, we cover sampling. Sampling lays the foundation for the success of any statistical test. If the sample is not representative of the population you wish to study, then the statistical tests will not help you understand the population. Deciding what type of sample is appropriate and the strengths and drawbacks of each choice will allow you to think critically about the samples used in any research you want to use to inform your work.
The last chapters of the book introduce hypothesis testing and a more complex branch of statistics called inferential statistics. Our coverage of inferential statistics includes t-tests, ANOVA, and chi-square tests. Inferential statistics are key to answering questions and doing research. Through inferential statistics you can take information you learn about a group or sample and determine what, if anything, you can say about a whole population. These chapters introduce the concept of p-values, which represent the likelihood that the values you observe in your sample have occurred by chance. This concept is essential to understanding and interpreting academic literature.
This book also introduces concepts that will help you collect and analyze data so you can track and measure your clients’ progress and whether or not interventions or treatments are effective. As a clinical practitioner or program administrator, you will want to know whether what you are doing is working. You may also be asked at some point to track data for grant applications or funding solicitations or to report on progress to an agency or sponsor that is responsible for ensuring the work you do is helping the clients you serve.
The final chapter of this book introduces a few more advanced concepts that you may come across and are at the forefront of questions about the use of statistics and research in social programs and policy. These more advanced concepts include regression analysis, p-hacking, and one- and two-tailed inferential tests.
Each topic covered in this book is a tool for you to develop an evidence-based practice. Understanding statistics and research is not sufficient for evidence-based practice, but it is necessary.
Evidence-based practice involves the convergence of three distinct types of information: a practitioner’s individual expertise, a client’s values and expectation, and best evidence. The statistical tools you will learn in this book will make you better able to understand and evaluate what should be considered “best evidence” (Shlonsky and Gibbs 2004).
2
CREATING USEFUL DATA
Data are the building blocks of statistics. Without data, you cannot use statistical analysis to learn about your clients or demonstrate the effectiveness of an intervention. Data come in different forms, and the forms can limit their possible uses. Understanding what type of data you have and its limitations will help you understand the populations the data describe. Once you understand the data you can collect, you can better learn about your clients or the efficacy of a policy or program.
Data-tracking systems and new technologies are transforming social work. Data are easier to collect than ever before. Social work and human services professionals are now relying on data-driven decision-making to inform work at the program, organization, and system levels. At the program level, data might be used to track the number of family assessments completed by a team or to evaluate intentional communication techniques in a marriage counseling class. At the organization level, integrating data into, for example, a juvenile justice and reentry program’s tracking system could help reduce recidivism rates by evaluating which activities have the largest effect on subsequent arrest rates. At the system level, a statewide mental health network could develop data-tracking procedure across provider networks to evaluate a new preventative counseling service. Doing so would allow practitioners and policy makers to understand the effects of the preventative counseling service on client outcomes and state dollars spent on more intensive interventions.
If you are a social worker who is working at any of these levels, you must be a good steward of the data you collect and understand how to wield those data effectively. This chapter introduces the foundational concepts for your future work with data.
LEARNING OBJECTIVES
By the end of this chapter, you should understand the following concepts:
• How percentages are calculated and used
• The relationship between proportions and percentages
• Levels of measurement and how to use them
• Which level of measurement is most useful to statistical analysis
HOW DO I USE PERCENTAGES TO DESCRIBE A POPULATION?
Data are often used in the form of frequencies or percentages. A frequency is a count of the number of times a thing occurs. A commonly used frequency is the number of individuals or participants in a study, denoted as either N (the number of participants in a population of people or things who share a common characteristic) or n (the number of participants in a subset, or sample, of a population). Other types of frequencies involve the number of people who share a specific characteristic.
Consider a study observing the grades of eighth-grade students in New York:
• N = 250,000 represents the number of eighth-grade students in the state of New York.
• n = 50 represents the number of eighth-grade students observed in the study.
• Among those 50 students, the following frequency of grades on a reading comprehension test was observed:

The frequency is the number of students who fall into each grading category.
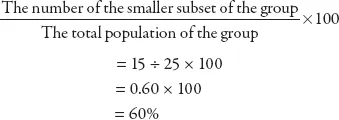
A percentage (%) is a ratio that compares a number to 100. Percentages are a useful tool for describing a sample. If your sample contains 25 participants and 15 are female, then we can say that 60 percent of the participants are female. A percentage of the larger group has the characteristic of being female. Percentages make it easier to understand the makeup of a group using a single number.
To calculate a percentage, divide the value representing a subset of a larger group by the total population of the group and then multiply by 100.
For example, for the number of students who are female in the previous example, you would use this calculation:
A proportion is a part or share of a whole and is another way to describe characteristics of a sample or group. Using the same example, if 15 members of a group of 25 are female, then it is the same as 3 out of 5 being female.
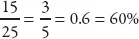
If 3 out of every 5 students are female, then the ratio of female students t...
Table of contents
- Cover
- Title Page
- Copyright
- Dedication
- Contents
- Acknowledgments
- 1. Introduction
- 2. Creating Useful Data
- 3. Understanding People and Populations
- 4. Variance: The Distance Between Us
- 5. The Statistics of Relationships
- 6. Sampling: The Who and the How
- 7. What Works?: Hypothesis Testing and Inferential Statistics
- 8. When Two Is Not Enough: Testing with Multiple Groups
- 9. An Introduction to Advanced Concepts
- Appendix I: Glossary
- Appendix II: Answer Key for Review Questions
- Appendix III: Equations Cheat Sheet
- References
Frequently asked questions
Yes, you can cancel anytime from the Subscription tab in your account settings on the Perlego website. Your subscription will stay active until the end of your current billing period. Learn how to cancel your subscription
No, books cannot be downloaded as external files, such as PDFs, for use outside of Perlego. However, you can download books within the Perlego app for offline reading on mobile or tablet. Learn how to download books offline
Perlego offers two plans: Essential and Complete
- Essential is ideal for learners and professionals who enjoy exploring a wide range of subjects. Access the Essential Library with 800,000+ trusted titles and best-sellers across business, personal growth, and the humanities. Includes unlimited reading time and Standard Read Aloud voice.
- Complete: Perfect for advanced learners and researchers needing full, unrestricted access. Unlock 1.5M+ books across hundreds of subjects, including academic and specialized titles. The Complete Plan also includes advanced features like Premium Read Aloud and Research Assistant.
We are an online textbook subscription service, where you can get access to an entire online library for less than the price of a single book per month. With over 1.5 million books across 990+ topics, we’ve got you covered! Learn about our mission
Look out for the read-aloud symbol on your next book to see if you can listen to it. The read-aloud tool reads text aloud for you, highlighting the text as it is being read. You can pause it, speed it up and slow it down. Learn more about Read Aloud
Yes! You can use the Perlego app on both iOS and Android devices to read anytime, anywhere — even offline. Perfect for commutes or when you’re on the go.
Please note we cannot support devices running on iOS 13 and Android 7 or earlier. Learn more about using the app
Please note we cannot support devices running on iOS 13 and Android 7 or earlier. Learn more about using the app
Yes, you can access Statistics in Social Work by Amy Batchelor in PDF and/or ePUB format, as well as other popular books in Social Sciences & Education Theory & Practice. We have over 1.5 million books available in our catalogue for you to explore.