![]()
1Introduction to geomorphology
In this chapter I introduce some fundamental concepts related to spatial and temporal scales of landforms and some basic material on the primary forces driving landform evolution: internal (geological) and external (climatic) forces.
1.1 What do we mean by ‘landforms’?
Geomorphology is the scientific study of the landforms of the surface of the Earth. These forms encompass a range of scales from that of, for example, the Earth’s major plains, plateaux and mountain ranges to that of small-scale forms, such as a beach or a river bank. Landforms of various scales are nested within one another so that within a mountain range, for example, there are individual mountain ridges and valley systems; within valley systems there are valley-side slopes and river channels; and within river channels there are gravel and sand bars. Studying landforms and the processes that create them inevitably involves study over a range of temporal and spatial scales. The processes that create the landforms include the creation of the relief itself and its modification by erosion and deposition. The temporal scales range from the short-term timescales at which some erosion processes operate, to the longer-term timescales of Earth history. The spatial scales range from large scales related to the global distribution of the relief forms of the land surface and the sea floor to local scales of, for example, individual hillslopes or river channels.
As a science, geomorphology lies between the traditional disciplines of physical geography, the study of the natural environment, and geology, the study of the solid Earth. As the Earth’s surface forms part of the natural environment, geomorphology interacts with the other sciences that deal with environmental systems: climatology, hydrology, pedology (soil science) and ecology. It also interacts with several subdisciplines of geology, especially with tectonics and structural geology in relation to deformation of the Earth’s crust, with sedimentology in relation to the properties of sediments, the products of erosion at the Earth’s surface, and with stratigraphy, the account of Earth history.
This interface between geology and environment influences the spatial and temporal scales relevant to the study of geomorphology. In the simplest terms, internally driven (geological) forces generally tend to operate over large spatial and long time scales. They create the gross or available relief of the Earth’s surface by deformation of the Earth’s crust. Externally driven forces, ultimately controlled by climate, modify this surface by erosion and deposition. These external processes can be described as the ‘sediment cascade’ and they create the more detailed landforms that form the heart of the study of geomorphology.
1.2 What we mean by spatial scales
At global and continental scales geomorphology deals with the major features of the surface of the Earth (e.g. continents, mountain systems). At a regional scale it deals with intermediate forms (e.g. individual mountain and hill ranges, river basins). At a local scale it deals with what could be described as individual features of conventional ‘scenery’ (e.g. rivers, hillslopes, beaches, glaciers), and at a micro-scale with the detail of the surface itself and its constituent materials (e.g. weathering phenomena, sedimentary details).
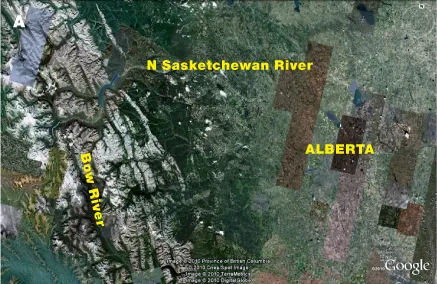
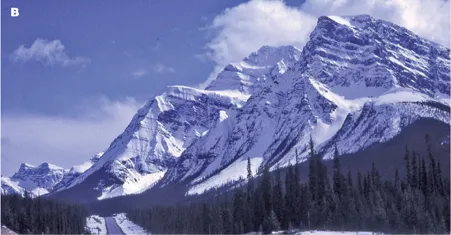
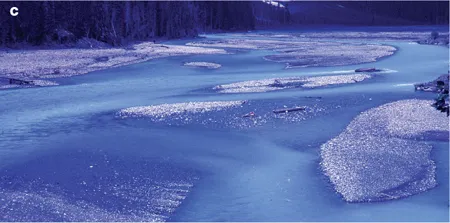
This book is organised around these themes, with the main chapters devoted to global scales, regional scales, with local and micro-scales treated together. Figure 1.1 shows how different features are apparent at different scales. On the Google Earth satellite image of western Canada (Figure 1A), features related to global/continental scales are most apparent. The NNW–SSE alignment of the major structures of the Rocky Mountains dominate the west of the image. These structures relate to the plate tectonics context (see below) of the North American continental plate, convergent with the oceanic Pacific plate. In contrast, the Canadian Prairies present a much more uniform land surface, formed over a much more stable zone of the Earth’s crust. In addition to the geological features the vegetation cover reflects major continental-scale climatic contrasts. The grassland of the southern Prairies contrasts with the forest cover further north and with the forested zones within the Rocky Mountains. Coming down a scale to that of a major valley within the Rockies (Figure 1B), the NNW–SSE alignments of the major mountain ridges and of the Saskatchewan and Bow river valleys are still apparent, but the mountain slopes dominate the image. Coming right down to the local scale (Figure 1C), the characteristics of the braided river channel dominate the photograph.
1.3 What we mean by temporal scales
The three spatial scales represented by the views shown in Figure 1.1 all relate to different timescales. The geological processes that formed the structures of the Rockies have been operating over 30–50 million years, but their tectonic uplift to form a mountain chain has probably occurred only over the last 10 million years or so. In the second view we are looking at a landscape that was periodically covered by ice sheets during the last half million years, then by huge valley glaciers that deepened the main valleys. The small glaciers in the Rockies today are merely diminutive remnants of much bigger bodies of ice that melted only 8–10 thousand years ago. The third view shows a river that has only existed for maybe 8000 years, but its detailed morphology is modified following every flood generated by summer storms or the annual snowmelt flood in the spring.
Figure 1.1 A. Examples of scale in geomorphology, illustrated by the Canadian Rocky Mountains. Continental scale, represented by a satellite image – ©Google Earth image of the Rocky Mountains and adjacent areas of the Canadian Prairies. The timescale related to the development of the physical features depicted on the image is one of millions of years. Note the contrast between the structurally complex mountain chain and the structurally stable area to the east, where the plains are underlain by near-horizontal bedrock. Note also how the satellite image brings out the vegetation contrasts between the grasslands of the southern Prairies and the forested areas further north and in the mountains.
Figure 1.1 B. Examples of scale in geomorphology, illustrated by the Canadian Rocky Mountains. Regional (landscape) scale photograph looking south along the Bow Valley within the Rocky Mountains. At this scale the straight alignment of the main valley is clear, as is the mountain morphology to the west. The westerly dip of the sedimentary rocks forming the mountains is clear, as are the glacial erosional features on the mountains and the scree slopes at the base. The timescale related to the development of the landforms visible in the photo is one of tens of thousands of years.
Figure 1.1 C. Examples of scale in geomorphology, illustrated by the Canadian Rocky Mountains. Detailed photograph of the bed of the braided river channel of the North Saskatchewan River within the Canadian Rockies. Note the milky colour of the water, due to suspended sediment, released by melting glaciers within the catchment of the river. Note also the gravel bars on the bed of the river. This river has only existed for the last 8000 years or so, and its detailed form is modified at least annually by snowmelt floods.
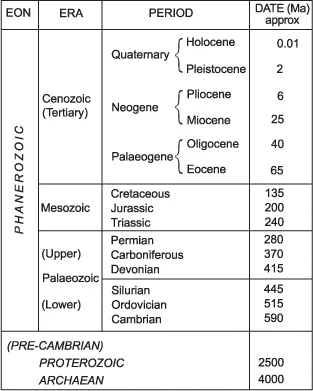
To grasp this wide range of timescales we need to know a little about geological time, and especially about the particular timescales relating to approximately the last two million years. The Earth as a planet is about 4000 million years old. These vast ages have been determined on the basis of the decay rates of radioactive elements contained within the rocks of the crust. The later 15% of geological time (the Phanerozoic; see Figure 1.2A) is divided on the basis of fossil evidence into a system of eras and periods, related to the evolution of life forms on the Earth. The landforms of the surface of the Earth are young in relation to geological time. Most of the detailed form has developed only over the last 1.6 million years or so during the Quaternary (the Pleistocene and the Holocene; Figure 1.2B). The present (Alpine) system of mountain ranges dates largely from the mid-Cenozoic (c.25 million years) and the modern pattern of continents and ocean basins dates largely from the early Cenozoic (65 million years). Only in parts of Australia and Africa can Mesozoic landform patterns be recognised to any great extent. However, older mountain systems can be recognised in the structural patterns and to a certain extent in the relief of all the continents. It is with Quaternary (see Figure 1.2B) timescales (the last 1.6 million years) that the geomorphologist is most concerned.
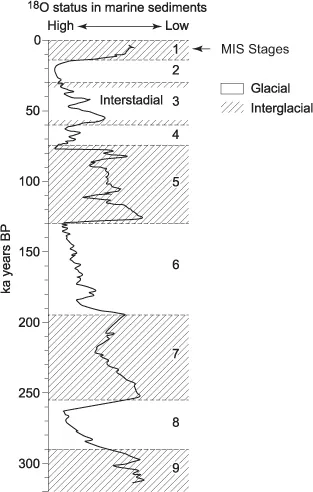
The modern basis for subdivision of the Quaternary is climate. Over the last 1.6 million years there have been numerous climatic oscillations. Interglacial conditions (such as the present time) have alternated with global glacial periods, when lower global temperatures allowed large ice sheets to form over much of the northern continental areas, in addition to the more permanent ice sheets over Greenland and Antarctica. These oscillations are caused by cyclic variations in the Earth’s orbital characteristics (Milankovitch cycles: named after the Yugoslav mathematician who discovered them). We shall deal with the effects in Chapter 2. Here we deal with the modern basis for Quaternary chronology. The chronology is based on the oxygen isotope record preserved in ocean-floor sediments and in the glacial ice of Greenland and Antarctica. The two isotopes of oxygen (O16 and O18) have different temperature-related potentials for evaporation. Hence, atmospheric concentrations of each isotope are enhanced and seawater concentrations diminished, or vice versa, as the result of fluctuations in the global temperature, and particularly in the volume of water in the oceans, which reflect global glacial/interglacial cycles. Oxygen isotope ratios preserved within the calcium carbonate (CaCO3) of foraminifera shells (small marine protozoans) or within ice crystals therefore vary with the global glacial/interglacial cycles. Figure 1.2B summarises the oxygen isotope record for last 300,000 years of the middle and late Quaternary derived from the marine record. The warm interglacial or mild interstadial phases are given odd numbers increasing in age from the modern Holocene, Marine Isotope Stage 1 (MIS 1). MIS 3 was an interstadial, not as warm as the Holocene, and the last major interglacial (MIS 5) occurred around 125,000–90,000 years ago. The intervening cold or glacial phases of the Pleistocene are numbered with even numbers increasing in age from the last glaciation (MIS 2). This and earlier glaciations during MIS 6 and MIS 8 were particularly important for geomorphology (see Section 1.4 below). The oxygen isotope-based chronology and notation has largely replaced the Alpine, Northern European or American regional terminology previously used to define glacial phases. The modern approach to Quaternary chronology is based on the global climatic sequence rather than on local and incomplete stratigraphic sequences.
Figure 1.2 A. Geological timescales. Geological timescale.
Figure 1.2 B. Geological timescales. Timescale for the last 300,000 years of the Quaternary: based on the oxygen isotope record from foraminifera in marine sediments. The nomenclature for the stages here labelled MIS (Marine Isotope Stages) replaces the earlier OIS (Oxygen Isotope Stages) nomenclature.
The last 10,000 years (The Holocene: MIS 1) have been important in modifying the effects on the landscape of the environments of the last global glacial (MIS 2). They have also been important for another reason. For the latter half of the Holocene humans have had an increasing impact on the landscape. For the majority of this timespan the natural landscape was progressively modified by human settlement and the development of agriculture. The evidence for geomorphic change is intimately linked with that for vegetation change and with archaeological evidence for the development of human societies. Over the last 200 years or so the human impact on geomorphic systems has accelerated enormously, both indirectly through radical changes to the properties of the Earth’s surface, especially through vegetation change, and more directly through engineering interventions in the sediment cascade. We will consider timescales of landform evolution in more detail in Chapter 5 and human impact on geomorphology in Chapter 6.
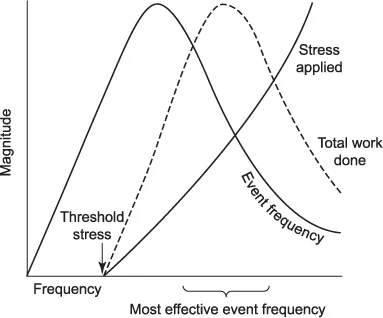
There is still another approach to timescales that is important in understanding geomorphic processes (Chapter 4). The effectiveness of individual geomorphic events (e.g. floods, landslides) tends to increase with their rarity. For example, a flood that occurs on average once every 100 years (ie. with a recurrence interval of 100 years) will bring about much more erosional change than a flood that occurs on average once every five years. However, because we might expect there to be 20 five-year floods for every 100-year flood, the overall and cumulative effects of the five-year floods may be greater. This concept, referred to as the magnitude and frequency concept, was developed in the 1960s in a classic paper by Gordon Wolman and John Miller (see Figure 1.3), where they demonstrated that in active landscapes the greatest cumulative amount of geomorphic work done (erosion, sediment transport, deposition) was carried out by events of moderate magnitude and frequency. Active landforms, especially in river systems, tend to adjust to such events by erosion and deposition. For example, river channels (see Chapter 4) tend to be maintained by a balance between erosion and deposition at a size related to such moderate events.
Two major elaborations of this concept were developed particularly in the concept of geomorphic sensitivity by Dennis Brunsden and John Thornes, and in the geomorphic threshold concept by Stanley Schumm. A landscape or geomorphic system is said to be sensitive if recovery from a major disturbing event, such as a major flood, is long-drawn-out in relation to the frequency of the disturbing event. In such landscapes there is a relatively high probability of further disturbance before the system has recovered from the previous event, for example if re-vegetation of eroded slopes is slow. On the other hand, landscapes that recover quickly from disturbance are said to be robust.
Figure 1.3 Relationships between event magnitude and frequency and geomorphic work done (modified from the classic work of Wolman and Miller).
At a larger scale, a landscape may undergo sudden and rapid changes from one state to another, for example from stable to gullied hillslopes or from a meandering to a braided river channel. Such a landscape is said to have crossed a geomorphic threshold. These thresholds may be related to internal properties ...