Big Data Analytics Methods unveils secrets to advanced analytics techniques ranging from machine learning, random forest classifiers, predictive modeling, cluster analysis, natural language processing (NLP), Kalman filtering and ensembles of models for optimal accuracy of analysis and prediction. More than 100 analytics techniques and methods provide big data professionals, business intelligence professionals and citizen data scientists insight on how to overcome challenges and avoid common pitfalls and traps in data analytics.
The book offers solutions and tips on handling missing data, noisy and dirty data, error reduction and boosting signal to reduce noise. It discusses data visualization, prediction, optimization, artificial intelligence, regression analysis, the Cox hazard model and many analytics using case examples with applications in the healthcare, transportation, retail, telecommunication, consulting, manufacturing, energy and financial services industries. This book's state of the art treatment of advanced data analytics methods and important best practices will help readers succeed in data analytics.
Trusted by 375,005 students
Access to over 1 million titles for a fair monthly price.
Data Analytics should be contrasted from business intelligence for two reasons: First, business intelligence (BI) deals with raw business data, typically structured data, and provides insight and information for business decision making. It is used and defined broadly to include business data query and analysis. In contrast data analytics deals with deep insights from the data that go beyond the internal data including external data, diverse data formats and data types, unstructured as well as structured data. Data analytics utilizes more advanced statistical methods and analytics modeling than BI and often deals with much more complex and unstructured data types.
Data analytics increasingly deals with vast amount of data—mostly unstructured information stored in a wide variety of mediums and formats—and complex data sets collected through fragmented databases during the course of time. It deals with streaming data, coming at you faster than traditional RDBMS systems can handle. This is also called fast data. It’s about combining external data with internal data, integrating it and analyzing all data sets together.
Data analytics approaches data schema from a different angle. BI analysis deals with structured data mostly stored in RDBMS systems which treat data schema on write. This implies that we must define the data schema before storing the data in a data warehouse. But, big data analytics deals with data schema on read, programmatically by the data engineer or data scientist as part of preparing data for analysis.
When using this broad definition, data analytics requires data collection, data integration, data transformation, analytical methods, decision support, business rules, reporting and dashboards. A broader definition would add data management, data quality, and data warehousing to the mix. Higher adoption of electronic medical records and digital economy are creating a big data opportunity, making big data analytics more relevant and feasible.
There are similar challenges yet significant differences between data analytics and business intelligence. Many of the challenges to get the right business intelligence (BI) are the same in getting the right data analytics. Business intelligence has been defined as the ability to understand the relationships of presented facts in such a way to guide action towards a desired goal.11
This definition could apply to both BI and data analytics. But on closer examination, their differences are critical to note.
One difference is the nature of data and the other is purpose. Business intelligence provides business insight from raw data for the purpose of enabling strategy, tactics, and business decision making. In contrast big data analytics strives to provide insight to enable business decisions from vast amounts of data which are often ambiguous, incomplete, conditional and inconclusive. The third difference is that often higher accuracy of analysis is needed to make the right decisions. These factors combine to create a complex analytical environment for the data scientists and data analytics practitioners.
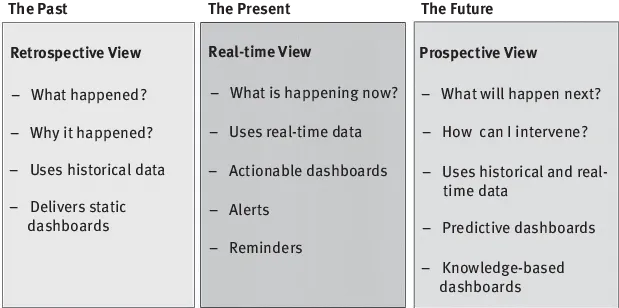
Big data analytics aims to answer three domains of questions. These questions explain what has happened in the past, what is happening right now and what is about to happen.
The retrospective analytics can explain and present knowledge about the events of the past, show trends and help find root-causes for those events. The real-time analysis shows what is happening right now. It works to present situational awareness, alarms when data reaches certain threshold or send reminders when a certain rule is satisfied. The prospective analysis presents a view in to the future. It attempts to predict what will happen, what are the future values of certain variables. Figure 1.1 shows the taxonomy of the three analytics questions.
Figure 1.1: The three temporal questions in big data analytics.
1.2 The Distinction between BI and Analytics
The purpose of business intelligence (BI) is to transform raw data into information, insight and meaning for business purposes. Analytics is for discovery, knowledge creating, assertion and communication of patterns, associations, classifications and learning from data. While both approaches crunch data and use computers and software to do that, the similarities end there.
With BI, we’re providing a snapshot of the information, using static dashboards. We’re working with normalized and complete data typically arranged in rows and columns. The data is structured and assumed to be accurate. Often, data that is out of range or outlier are removed before processing. Data processing uses simple, descriptive statistics such as mean, mode and possibly trend lines and simple data projections to extrapolation about the future.
In contrast data analytics deals with all types of data both structured and unstructured. In medicine about 80% of data is unstructured and in form of medical notes, charts and reports. Big data analytics approaches do not mandate data to be clean and normalized. In fact, they make no assumption about data normalization.
Data analytics may analyze many varieties of data to provide views into patterns and insights that are not humanly possible. Analytics methods are dynamic and provide dynamic and adaptive dashboards. They use advanced statistics, artificial intelligence techniques, machine learning, deep learning, feedback and natural language processing (NLP) to mine through the data. They detect patterns in data to provide new discovery and knowledge. The patterns have a geometric shape and these shapes as some data scientists believe, have mathematical representations that explain the relationships and associations between data elements.
Unlike BI dashboards that are static and give snapshots of data, big data analytics methods provide data exploration, visualization and adaptive models that are robust and immune to changes in data. The machine learning feature of advanced analytics models is able to learn from changes in data and adapt the model over time. While BI uses simple mathematical and descriptive statistics, big data analytics is highly model-based. A data scientist builds models from data to show patterns and actionable insight. Feedback and machine learning are concepts found in data analytics not in BI. Table 1.1 illustrates the distinctions between BI and data analytics.
Table 1.1:The differences between business intelligence and data analytics.
Dirty data, missing & noisy data, non-normalized data
Normalized data
Non-normalized data, many types of data elements
Data snapshots, static queries
Streaming data, continuous updates of data & models, feedback & auto-learning
dashboards snapshots & reports
Visualization, knowledge discovery
1.3 Why Advanced Data Analytics?
For years, the most common and traditional form of data analysis has been grounded in linear and descriptive analytics mostly driven by the need for reporting key performance measures, hypothesis testing, correlation analysis, forecasting and simple statistics; no artificial intelligence was involved.
But, big data analysis goes beyond descriptive statistics. While descriptive statistics are important to understanding and gaining insight about data, big data analysis covers broader and deeper methods to study data and interpret the results. These methods include machine learning (ML), predictive, classification, semantic analysis and non-linear algorithms and as well as the introduction of multi-algorithm approaches.
Traditionally, descriptive statistics answer “what” but offer little help on “why” and “how.” They are good at making generalizations about one population versus another, but perform poorly on an individual basis. One example of analytics is classification. A descriptive statistics measure might suggest that 65% of patients with certain preconditions to a disease respond to a specific therapy. But, when a patient is diagnosed with the disease how can we determine if the patient is among the 65% of the population?
Descriptive statistics look at the past events, but it’s not ideal for predicting what will happen in the future. Similarly, descriptive statistics offer little insight about causal relationships that help researchers identify root causes of input variables that produce an outcome. While descriptive analytics offers simple tools to determine what is happening in the environment of care, and populations of patients, they come short in giving us the details often necessary to make more intelligent and dynamically adaptive decisions. Big data analytics emphasizes building models and uses model building as a repeatable methodology for data analysis.
Big data analysis can help with customer classifications not just by the traditional demographics factors such as age, gender and life styles, but by other relevant characteristics related to a diverse set of data collected from primary and secondary sources including sources of data exhaust. The definitions for primary, secondary and exhaust data are fuzzy. But, here is an example to illustrate. When you make an electronic purchase on a mobile device your transaction produces primary data. Secondary data might include the geolocation of your purchase. Data exhaust is the side effect of the transaction. For example, the amount of time you took to complete the transaction.
Big data analysis gives us the ability to perform multi-factorial analysis to determine the utility (or value) associated with different courses of strategy and execution factors. Such analysis reveals the key indicators, predictors and markers for observed outcomes. Analytics enables us to “see” these indicators including previously over-looked indicators and apply the correct weight (or consideration) to these indicators when making decisions.
Big data analysis can be used to calculate more accurate and real time measure of business risk, predictors of business outcomes and customer’s next move. It can analyze structured and unstructured data to deliver quantitative and qualitative analysis. It can learn from markets, customer data and recommend best options for any given situation.
However, there are many challenges related to the format, meaning and scale of data. To compound the problem, much of the data is unstructured, in form of free text in reports, charts and even scanned documents. There is a lack of enterprise wide dictionary of data terms, units of measure and frequency of reporting. Much of the big data may have data “quality” issues: data may be missing, duplicate, spar...
Table of contents
Title Page
Copyright
Contents
Acknowledgments
About the Author
Introduction
Part I: Big Data Analytics
Part II: Advanced Analytics Methods
Part III: Case Study—Prediction and Advanced Analytics in Practice
References
Index
Frequently asked questions
Yes, you can cancel anytime from the Subscription tab in your account settings on the Perlego website. Your subscription will stay active until the end of your current billing period. Learn how to cancel your subscription
No, books cannot be downloaded as external files, such as PDFs, for use outside of Perlego. However, you can download books within the Perlego app for offline reading on mobile or tablet. Learn how to download books offline
Perlego offers two plans: Essential and Complete
Essential is ideal for learners and professionals who enjoy exploring a wide range of subjects. Access the Essential Library with 800,000+ trusted titles and best-sellers across business, personal growth, and the humanities. Includes unlimited reading time and Standard Read Aloud voice.
Complete: Perfect for advanced learners and researchers needing full, unrestricted access. Unlock 1.4M+ books across hundreds of subjects, including academic and specialized titles. The Complete Plan also includes advanced features like Premium Read Aloud and Research Assistant.
Both plans are available with monthly, semester, or annual billing cycles.
We are an online textbook subscription service, where you can get access to an entire online library for less than the price of a single book per month. With over 1 million books across 990+ topics, we’ve got you covered! Learn about our mission
Look out for the read-aloud symbol on your next book to see if you can listen to it. The read-aloud tool reads text aloud for you, highlighting the text as it is being read. You can pause it, speed it up and slow it down. Learn more about Read Aloud
Yes! You can use the Perlego app on both iOS and Android devices to read anytime, anywhere — even offline. Perfect for commutes or when you’re on the go. Please note we cannot support devices running on iOS 13 and Android 7 or earlier. Learn more about using the app
Yes, you can access Big Data Analytics Methods by Peter Ghavami in PDF and/or ePUB format, as well as other popular books in Business & Business General. We have over one million books available in our catalogue for you to explore.