![]()
Part I
Overview
Low carbon Arctic energy system
![]()
1 A low carbon Arctic energy system?
Challenges, opportunities, and trends
Tom Marsik and Nathan Wiltse
Introduction
The Arctic has a unique position in the global energy system. Not only does it contribute to the global fossil fuel use through its own consumption and exports, it also greatly suffers the consequences of global fossil fuel use due to climate change and polar amplification (NASA, 2013). The warming of the Arctic is posing numerous challenges for inhabitants, including the need to sometimes relocate whole communities (Mooney, 2015). Impacts of climate change coupled with other issues, such as depleting finite resources, has led Arctic stakeholders to adopt initiatives for decreasing fossil fuel use and reducing carbon emissions. This chapter, as a starting point of the discussion in the whole book, provides a brief overview of the current energy situation as well as challenges and opportunities for achieving a low carbon Arctic energy system.
Energy use in the Arctic
Current situation
Arctic energy consumption
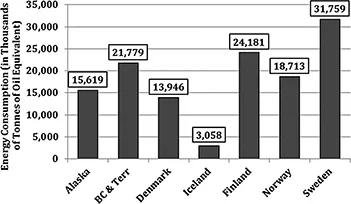
Excluding Russia,1 annual energy consumption from all energy types in the Arctic is approximately equivalent to 129,000 KTOE (thousand tonnes of oil equivalent) or about 12 percent of the consumption of the European Union’s 28 countries (see Figure 1.1). One KTOE is equivalent to 41,868 gigajoules. A majority (71 percent) of the energy consumption occurring in the Arctic is in European nations.2 Alaska (US) consumes about two-thirds the energy that the combined Canadian areas of British Columbia, Yukon Territory, Northwest Territory, and Nunavut (British Columbia (BC) & Territories)3 consume.
Figure 1.1 Annual energy consumption by Arctic region (KTOE), 2015.
Sources: Comprehensive Energy Use Database (NRCan, 2017); Eurostat (Eurostat, 2018); State Energy Data System (EIA, 2017).
Consumption per capita
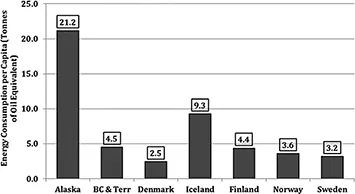
A more useful metric for comparing the adoption of energy efficiency by Arctic regions is annual energy consumption per capita. Looking at these values, Alaska and Iceland are the main per capita energy consumers (about 21 and nine tonnes of oil equivalent per person respectively), while Scandinavian nations range from 2.5 to 4.4 tonnes of oil equivalent (TOE) per person (see Figure 1.2). Alaska’s low population, and large petroleum and mining industries mean that over half of its per capita energy consumption comes from the industry sector. Further, Alaska has an abundance of cheap (subsidized) natural gas used by the two main population centers that account for approximately half of its population. Approximately half of Alaska’s per capita consumption is natural gas. Iceland has an abundance of cheap geothermal energy that drives the electrical production and derived heat.
Figure 1.2 Annual energy consumption per capita by Arctic region (TOE), 2015.
Sources: Comprehensive Energy Use Database (NRCan, 2017); Eurostat (Eurostat, 2018); State Energy Data System (EIA, 2017); Alaska population estimates (DOL, 2018); Canadian population estimates (CANSIM, 2017); Denmark population estimates (Statistics Denmark, 2018); Finland population estimates (Statistics Finland, 2017); Iceland population estimates (Statistics Iceland, 2017); Norway population estimates (Statistics Norway, 2017); Sweden population estimates (Statistics Sweden, 2017).
Consumption by energy type
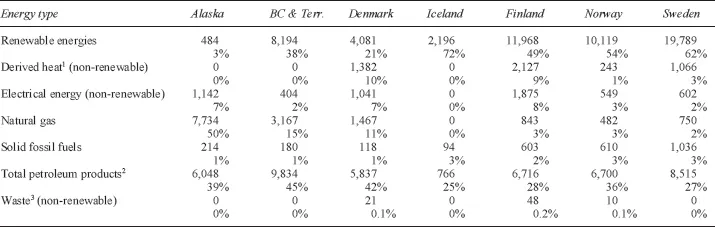
While fossil fuels dominate energy consumption in the circumpolar region as a whole, the individual Arctic regions have differing access to energy resources and use a variety of fuel types (see Table 1.1). The least fossil fuel dependent region is Iceland, where about three-fourths of the energy consumption come from renewable sources. In contrast, almost all of Alaska’s energy consumption is covered by fossil fuels. Overall, Arctic regions meet about 44 percent of their consumption with renewable energy.4
Table 1.1 Annual energy consumption by fuel type for Arctic regions (KTOE), 2015
Sources: Comprehensive Energy Use Database (NRCan, 2017); Eurostat (Eurostat, 2018); State Energy Data System (EIA, 2017); Statistics Canada (CANSIM, 2017).
Note
Consumption by sector
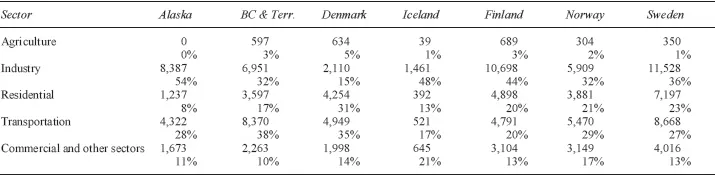
For the majority of Arctic regions, industrial energy consumption is the major consumer of energy (see Table 1.2). With the exception of Iceland, the second major end use sector is transportation. For all Arctic regions these two end use sectors comprise between 50 percent and 82 percent of energy consumption. While the energy consumption of aviation often receives press, for all five European regions, road transportation energy consumption exceeds both international and domestic aviation combined.
Table 1.2 Annual energy consumption by end use sector for Arctic regions (KTOE), 2015
Sources: Comprehensive Energy Use Database (NRCan, 2017); Eurostat (Eurostat, 2018); State Energy Data System (EIA, 2017).
Trends in energy use in the Arctic
Trends in consumption
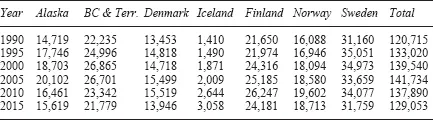
Over the 25-year period from 1990 to 2015, most Arctic regions saw a period of increased energy consumption, with the overall energy consumption for the seven Arctic regions (excluding Russia) increasing by 8,332 KTOE for the period. Some regions saw early increases in overall energy consumptions followed by decreases. These peaks occurred at different times for different regions. Sweden’s, for example, came in the mid-1990s while Alaska’s came in the mid-2000s. Iceland’s energy consumption has more than doubled in the past 25-years on a trajectory of steady growth (see Table 1.3).
Table 1.3 Historical annual energy consumption (KTOE), 1990 to 2015, by Arctic region
Sources: Comprehensive Energy Use Database (NRCan, 2017); Eurostat (Eurostat, 2018); State Energy Data System (EIA, 2017).
Trends in consumption per capita
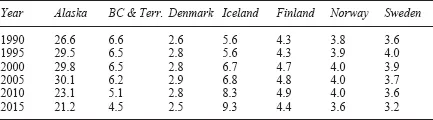
In observing energy consumption over time, a per capita examination can be helpful. Iceland’s doubling of energy consumption is actually mirrored in its per capita data, indicating that the energy consumption is not due to an increase in population, but rather primarily due to growth in the industrial sector (see Table 1.4). On the other hand, BC & Territories, which showed fairly stable energy use in Table 1.3, show a significant decrease (about 33 percent) in energy consumption per capita over the 25-year period. This was driven primarily by decreases in overall industrial energy consumption. Alaska is notable as its energy consumption per capita is between four and five times that of BC & Territories. Starting in 2005, Alaska saw a 30 percent decrease in per capita energy consumption over the following ten years ending in 2015. This decrease was primarily driven by nearly equal decreases in industrial energy consumption and transportation consumption over that period. However, with an energy consumption per capita of 21.2 TOE in 2015, Alaska residents still consume nearly ten times the energy of Danish residents and more the twice the energy of Iceland residents. As mentioned previously, over half of Alaska’s per capita consumption comes from the industrial sector.
Table 1.4 Historical annual energy consumption per capita (TOE), 1990 to 2015, by Arctic region
Sources: Comprehensive Energy Use Database (NRCan, 2017); Eurostat (Eurostat, 2018); State Energy Data System (EIA, 2017); Alaska population estimates (DOL, 2018); Canadian population estimates (CANSIM, 2017); Denmark population estimates (Statistics Denmark, 2018); Finland population estimates (Statistics Finland, 2017); Iceland population estimates (Statistics Iceland, 2017); Norway population estimates (Statistics Norway, 2017); Sweden population estimates (Statistics Sweden, 2017).
Trends in consumption by energy type
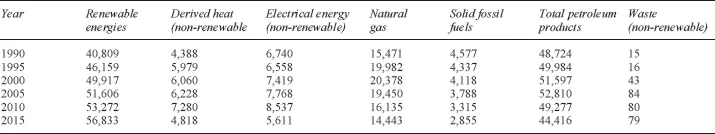
As noted previously, overall the energy consumption for the seven Arctic regions (excluding Russia) has increased over the past 25 years. The consumption of renewable energy has increased by 16,025 KTOE, while the fossil fuel consumption saw a decrease of 7,692 KTOE over the 25-year period (see Table 1.5).
Table 1.5 Historical annual energy consumption (KTOE), 1990 to 2015, by fuel type
Sources: NRCan—Natural Resources Canada (NRCan, 2017); Eurostat (Eurostat, 2018); State Energy Data System (EIA, 2017); Statistics Canada (CANSIM, 2017).
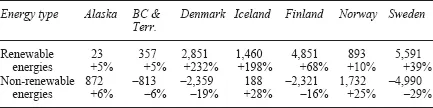
Increases in renewable energy consumption were driven by the countries of Denmark, Iceland, Finland, and Sweden (see Table 1.6). Denmark’s consumption of renewable energy grew from 1,230 KTOE in 1990 to 4,081 KTOE in 2015, a 232 percent increase. Iceland’s consumption of renewable energy grew from 738 KTOE in 1990 to 2,198 KTOE in 2015, a 198 percent increase. Finland and Sweden saw increases of 4,851 KTOE and 5,591 KTOE respectively over the 25-year period. Increases for the four regions were larger than changes in population, resulting in an increase in per capita renewable energy use.
Table 1.6 Changes in renewable and non-renewable annual energy consumption (KTOE), 1990 to 2015
Sources: Comprehensive Energy Use Database (NRCan, 2017); Eurostat (Eurostat, 2018); State Energy Data System (EIA, 2017).
Trends in consumption by sector
The overall trends for the consumption by sector in the Arctic are shown in Table 1.7. The agricultural sector saw declines in energy consumption from all Arctic regions except BC & Territories and Iceland. The industrial sector saw a decrease in energy consumption driven primarily by BC & ...