![]()
Section II
Changes in London’s churches, 1980 to the present
![]()
2
The demography of religion in London since 19801
Eric Kaufmann
Demography is arguably the most important force affecting London’s religious landscape. As I point out in my book Shall the Religious Inherit the Earth, most people in the world get their faith the old-fashioned way, through birth.2 The connection between birth and religion brings demography powerfully to bear on the story of London’s religious change. Generally speaking, secularisation reduces religiosity while demographic change increases it. Population change is powering religious growth worldwide, overwhelming the smaller flow from religion to non-religion in the Western world. The shifting balance between secularisation and demographic religiosity is reflected in London. As a global city, it is a microcosm of the world’s demographic churn, a window into the future.
What are the global demographics of religion? Essentially all (97%) of the world’s population growth takes place in the developing world. The global South is also overwhelmingly religious – 95% according to the Gallup World Poll and World Values Surveys.3 The net result is that, despite more individuals moving from religion to non-religion in the West, the world is re-sacralising.4 This trend encompasses most faiths, including ‘established’ ones such as Catholicism and Anglicanism. This is because the zone I term the ‘religious tropics’ is growing while the more secular developed world is in the mature phase of its demographic transition.
The population in Western Europe would be in absolute decline without immigration, and with population ageing set to increase to the point where 30–40% of Western Europeans will be over the age 60 by 2050, we should expect continued inflows in the coming decades.5 Those of non-European origin make up half of American babies and form an increasing share of Europe’s population. On the back of this ethnic change comes religious change. Religious people from the global South – Christian and non-Christian alike – are supplanting an increasingly secularised European-origin population. Nowhere is this more evident than in ‘gateway cities’ of Europe, such as London, Paris or Amsterdam, where the changes are concentrated.
Because this volume focuses on London, a geographically limited area, we need a handle on local-level religious mobility as well as international migration. This means examining the geographic shifts of different ethnic groups into, and out of, the city. Domestic migration tends to accentuate the shifts brought about by global migration because minority increase is typically associated with an absolute decrease in the white majority population of a city. London, for instance, lost 620,000 white British people from its population in the 2000s. These internal ethnic shifts caught forecasters by surprise because those who developed ethnic projections for London did not adequately account for groups’ disparate propensity to enter or leave.6 Accordingly, an important part of this chapter focuses on patterns of ethnic mobility – segregation, ‘white flight’ and so on – in London since 1980. Finally, I examine religious identity and practice within London’s population.
The demography of London
The population of London rose through the 19th century to a peak of 8.6 million in 1939. The war rudely interrupted this. Deindustrialisation, dock closure, wartime evacuation and ongoing slum clearance drove half a century of decline. Only in the early 1990s did the city’s population begin to rebound, and in early 2015, London overtook its 1939 population peak. Historic census data permit us to track the elements which contributed to London’s population growth in the 19th century. For much of that century, like all of human history, cities were unsanitary, with close quarters and poor sanitation leading to the spread of infectious diseases.7
The impulse of many was to leave the city as they got older; thus, it relied heavily on a young population and a high birth rate to maintain growth. London’s industries attracted more migrants from the rest of the UK than those who left, but the terms of trade began to shift in the 1860s. From 1871 onward, London lost more population to the rest of the UK than it gained from it, and by the 1880s, the net outflow of native-born to the rest of the UK was similar to what has been observed in the 2000s. This has led to a literature on ‘counterurbanisation’: that people with the means have always sought to leave London to find more spacious accommodation and pleasant surroundings.8 While this is important, we shall see that it does not adequately capture the fact that minorities with the means to do so have been more reluctant to leave London than have their white counterparts.
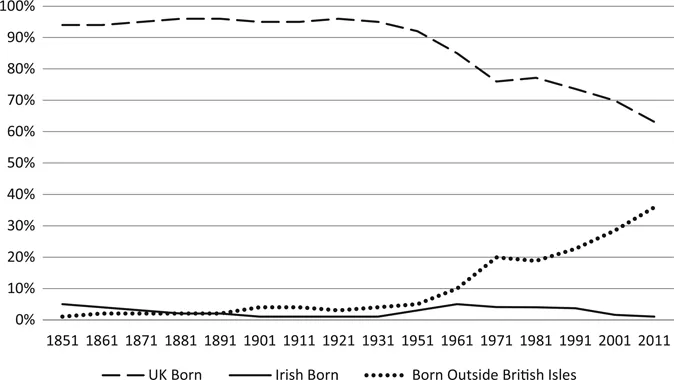
In ethnic terms, despite claims about its historic diversity, London in the 1851–1971 period was essentially a white British city with an important, but relatively small, population of white (i.e. Jewish, Irish) and non-white (i.e. South Asian, Afro-Caribbean) minorities. Its population was mainly nourished by an excess of native white births over deaths. However, as birth rates declined in the 1920s and 1930s, the share of London’s population born abroad rose above its historic level of 5%. By the 1970s, a quarter of the city was foreign-born, and by 2011, this had risen to nearly 40% (see Figure 2.1).
Figure 2.1 London’s population by birthplace, 1851–20119
London: the case of the disappearing white British
When results of the 2011 census were released, the figures showed that 620,000 fewer white British people lived in London than in 2001. This during a decade when the capital had boomed and added over a million people to its population. This meant the population inside the M25 had shifted from a clear white British majority of 58% in 2001 to a decided minority of 45% just one decade later. In some Outer London boroughs, change was especially rapid. Barking and Dagenham, for instance, was 81% white British in 2001 but just 49% in 2011. The biggest gains were posted by ‘Other Asians’ (including Arabs), up 233% – though much of this was due to the redistribution from other groups to this new category since the last census. Those of mixed race (+58%), white Europeans (+52%), and Africans and Chinese (+33%) also increased. Established minority groups had divergent patterns, with Afro-Caribbeans down 12% but South Asians up a healthy 17%.10
These facts produced a storm of coverage. Very quickly, two major narratives emerged. The first, represented by the Daily Mail strapline, ‘The Rise of “White Flight”: British Families “Self-Segregating” as More Caucasians Abandon Urban Areas for the Countryside’ (27 January 2013) claimed that white Britons had become uncomfortable with rising diversity in London, prompting them to flee. The counterclaim resounded in the Economist’s ‘Everyone Out’ piece (11 May 2013) which opined that established Londoners, whether minority or white British, had sold up and profited from the new influx. Here the motives were economic, not ethnic, though this reasoning suggests minorities were willing to pay a premium to be near the city – and, by extension, their co-ethnics. If true, this implies that minority and not white-led segregation underlies London’s ethnic shift. The number of comments on these articles reflected the passions evoked by the numbers, with BBC Home Affairs editor Mark Easton netting more than 2,000 comments for his ‘Why Have the White British left London?’ article (19 February 2013) before commentary was cut off.
A lack of census evidence for earlier periods (prior to 2001 the nonspecific ‘white’ rather than ‘white British’ was used) opened the door to all manner of claims. As there was no census question tapping white British ethnicity in the 1991 census, making a straight comparison of 1991–2001 and 2001–2011 ethnic shifts into, and out of, London, was impossible. Conservative papers alleging white flight were countered by liberal pundits or academics who suggested that the 620,000 figure did not necessarily reflect flows to other parts of the UK but could be the result of differences in birth and death rates between white British and other ethnic groups. In fact, both conservative and liberal arguments struck wide of the mark.
Ethnically selective net migration from London
Although we do not have census data, we can use the Office of National Statistics (ONS) Longitudinal Study (LS), a linked 1% sample of the census of England and Wales to reconstruct what happened in earlier decades. As Table 2.1 shows, London has experienced high white British net outflow in all decades since 1971.11
For example, the net loss of white British people in the ONS LS to the rest of England and Wales in the 2000s in the table is -4,009, which equates (as a 1% sample), to over 400,000. Adjusting for census undercount of w...