1.1 Energy, environment and economic growth in China
Since its economic reform from central planning to markets in 1978, China’s economic performance has been remarkable, and industry is the biggest growth-driven sector when compared with the agricultural and tertiary sectors. It is well known that the Chinese government opted for a heavy-industry-oriented development strategy to catch up with the developed world for a long time before the reform. This strategy, based on China’s comparative disadvantages, has resulted in the persistence of a dual economy. The higher than average rate of growth of industry depends on massive inputs of production resources, by using ‘price scissors’ to transfer resources from agriculture to industry. Though the industrial development strategy was adjusted during the reform period to emphasize both light and heavy industry evenly, the extensive growth model, with the characteristics of high growth, high investment, high energy use and heavy environmental pollution emission, has not changed greatly.
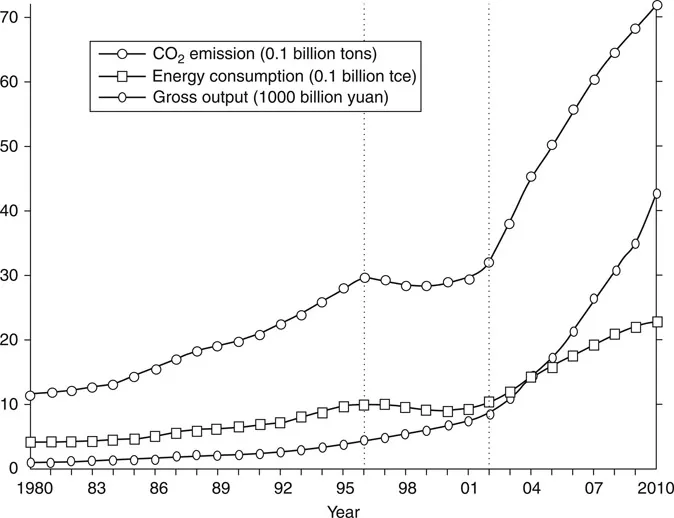
The depletion of fossil fuels and consequent increase in environmental pollution indicates, in particular, that this extensive model of economic development is not sustainable, and a transformation towards a low-carbon model is inevitable. Especially in recent decades, this transformation has been far from simple in China, because its rapid economic growth has depended heavily on high energy consumption and heavy waste emission. As depicted in Figure 1.1, industrial energy consumption and carbon dioxide (CO2) emission have seen continuous increase since the reform. In an attempt to speed up economic transformation, the central government has introduced a number of energy-saving and emission-abating policies and regulations. In particular, during the ownership rights reform period from 1996 to 2002, China employed the policy of furlough (xiagang) and aimed to ‘grasp the large and let go of the small’ (zhuada fangxiao) and shut down about 84,000 small energy and emission-intensive enterprises, causing the first stagnancy or decline of energy use and CO2 emission, as shown in the Figure. However, the phenomenon of heavy industrialization reappeared after 2002. Figure 1.1 shows that the consumption of primary energy and carbon emission had such an unprecedented increase after 2002 that it almost reversed the process of economic transformation already happening in China. Now, China became the world’s largest consumer of energy and emitter of CO2 in absolute terms, followed in both by the US, but only the second largest GDP producer, behind the US. In 2010, industrial energy consumption and CO2 emission achieved the peak of 2.3 billion tons of coal equivalent (tce) and 7.2 billion tons, respectively, while industrial gross output attained the absolute value of 42.6 trillion of RMB. In fact, during the period of the eleventh Five-Year Plan and the beginning of the twelfth Five-Year Plan, the central government also proposed official quantitative abating targets for energy and carbon intensity, respectively; but the results have yet to be seen, as its effects need further observation.
Figure 1.1 Industrial gross output, energy consumption and CO2 emission in China (1980–2010).
1.2 Total factor productivity, economic transformation and what do we learn from descriptive statistics of industrial and regional input and output panel data?
Since the pioneering work of Solow, rising total factor productivity (TFP) has been considered as a key engine of economic growth, along with quantitative increases in factors of production. Within the analytical framework of neoclassical growth accounting, a rising share of TFP in total output growth signals the transformation towards a development model based on quality rather than quantity (Solow, 1957; Kim and Lau, 1994; Krugman, 1994; Young, 1994). In particular, when the contribution of TFP growth to output growth exceeds that of the quantitative inputs of all factors, it can be said that the development model has been transformed from being extensive and unsustainable to being intensive and sustainable. This will be the basic economic theoretical framework used in this book to assess whether the traditional economic growth model has been transformed to become sustainable or not. Of course, in the literature, there is still some debate over the contribution of TFP growth to China’s output growth during the period of economic reforms since 1978, including whether and when its development model has already made this transformation. Chen, Jefferson and Zhang (2011) provide a relevant survey. In existing literature, however, measures of TFP have been usually calculated as the Solow residual in a growth accounting framework that only includes the traditional inputs of capital and labour, neglecting both the energy inputs required to sustain economic growth and their environmental impacts.
As described above, the estimation of the production function and then TFP requires the data on input as well as output quantities. To comprehensively analyse economic transformation, it is necessary for us to take both the energy inputs and the environmental factors into account, along with the traditional factors. Thus, the construction of new input and output databases that include the energy and environmental variables is extremely important for the analytical objectives of this book. As Jorgenson and Stiroh (1999, 2000) denoted, growth differs widely among industrial sectors or different regions. For the economy as a whole, negative growth in one sector or region can offset positive growth in another; therefore it is essential to disaggregate estimates of economic growth to the sub-industrial or provincial level to find the true pattern behind the aggregation. Following this approach, this book avoids the limitations of an aggregation analysis by breaking down Chinese economic analysis into industrial sectors and provincial levels, which should provide us with a new understanding of the forces driving the transformation of China’s economy. In particular, we constructed two types of database: two-digit sub-industrial and provincial panel data over the reform period is the basic research sample employed in the following chapters. In the Appendix, we introduce the principles behind the construction of the panel databases and report part of the input and output data. Here, we just briefly introduce the two types of database and, based on their descriptive statistics, assess whether we can see something useful in relation to productivity growth and economic transformation from both industrial and regional viewpoints.
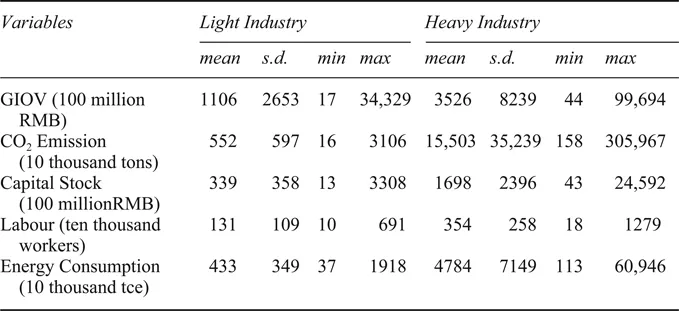
This research concentrates on the study of Chinese industry, rather than the whole economy, because the output, energy consumption and carbon emissions of Chinese industry account for most of the national total, and the analysis of it is bound to give us an overall picture of the aggregate economy. The two-digit sub-industries are classified according to the new version of the National Standard of Industrial Classification (GB/T4754), revised in 2002 in China. This information is constructed into the panel data for 38 sub-industries between 1980 and 2010, which will be used as the sample in most of the chapters, except Chapters 2 and 8, and it is expected to enhance the information available when analysing the microeconomic performance for each sector. The codes and names for the 38 sub-industrial sectors are in Table A.1 in the Appendix; they belong to three bigger categories: mining, manufacturing, utilities (electric power, gas and water production and supply). Table 1.1 reports the descriptive statistics for the main input and output variables used in this book.1 For example, the output variable is gross industrial output value (GIOV) with the unit of 100 million RMB at 1990 prices, rather than value-added, due to the possible inclusion of intermediate inputs, such as energy, into the analysis. The capital stock and CO2 emissions cannot be obtained directly and need to be estimated. The capital stock is estimated by using a perpetual inventory approach, depreciated at constant 1990 prices of investment in fixed assets, and CO2 emissions are estimated from three types of primary energy use, according to their different carbon emission coefficients. The labour input is the annual average number of employed workers (unit: 10 thousand workers) and energy input is total energy consumption with a unit of 10 thousand tce. To investigate the impact of energy on growth further, we divided all sectors into light and heavy industry according to the ranking of the absolute quantities of energy consumption in 2004.2 That is, the light industry corresponds to the top half of sectors with a lower energy consumption, and the heavy industry to the lower half of sectors with a larger value of energy use.
Table 1.1 Descriptive statistics of main sub-industrial variables used (1980–2010)
Table 1.1 brings into focus the contrast between light and heavy industry. The principal feature we obtain from this table is that the mean levels of capital stock and energy consumption in heavy industry are much higher than in light industry, respectively, with much smaller differences in the means of GIOV and labour. The averaged CO2 emissions in heavy industry are 28.1 times those in light industry. Obviously, high investment and energy consumption do not lead to equally higher output growth and employment, but they emit far higher levels of CO2. Also, there is a higher degree of variability within the heavy sub-industries for output and inputs, especially for energy and emissions, compared with the light sub-industries. Based on such statistical information, heavy industry in China holds the obvious characteristics of higher investment, higher energy consumption, higher carbon emission and higher variance in performance levels, but less output, which implies that there may be lower TFP and then more extensive growth in heavy industry than in light industry.
In Chapter 8, we compile data from a panel of 31 provinces to assess the low-carbon economic transformation from a regional perspective. The names of input and output variables, including energy consumption, electricity consumption and multiple environmental pollution emissions (such as CO2, COD, SO2, waste water and waste gas) and their sample period are outlined in Table 1.2.3 Unlike the traditional classification of eastern, middle and western regions, we divided all the provinces into low and high energy and emission regions, according to the classifying index built by ourselves4, to check the effect of different energy and emission levels on regional economic transformation. According to the classification, the low energy and emission region in this chapter includes 16 provinces, in which Beijing, Guangdong and Shanghai are ranked the top three, the value of their index being less or close to 0.5; the high energy and emission region includes 15 provinces, in which Guizhou and Ningxia are ranked the last two, the value of their index being greater than 2. The descriptive statistics of regional variables reported in Table 1.2 reveal similar information to the industrial Table 1.1. The regional value-added in the low energy and emission region is 2.1 times that of the high energy and emission region, but the inputs of capital, labour, energy and electricity in the former region are only 1.7, 1.4, 1.2 and 1.5 times the size of those in latter region. The environmental emissions (such as CO2, waste water, waste gas, COD) in the low energy and emission region are also only 1.2, 1.8, 1.1 and 1.3 times those of the high energy and emission region; the SO2 emission in the former region is even less than that in the latter region. The investment in the treatment of industrial and environmental pollutions in the low energy and emission group is higher than that in the high energy and emission group, though the area of afforestation in the former region is less than that in the latter. Such statistical information also implies that the low energy and emission region may have the higher TFP and therefore a more intensive growth model relative to the high energy and emission region. There also exists an abnormal phenomenon in Table 1.2. For instance, the standard deviation of all the variables except waste gas and afforestation in the low energy and emission region is higher than that in the high region. When looking at the maximum statistics, although Shandong is in the low energy and emission region, it has the highest CO2 emission and energy consumption in 2009 and the highest SO2 emission in 2005. Similarly, Guangdong is in low energy and emission region but also has the largest waste water emission and electricity consumption in 2009. In Chapter 7, we will investigate the impact of abnormal energy and emission distribution on regional low-carbon economic transformation.
Table 1.2 Descriptive statistics of main provincial variables used
1.3 What do the statistical indicators tell us about the economic transformation?
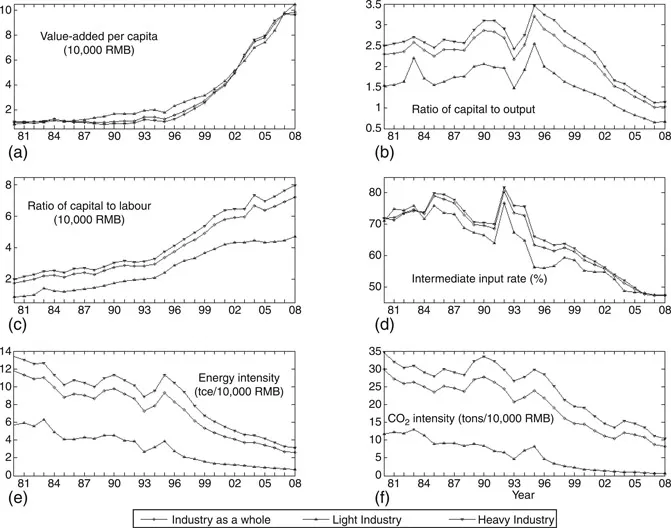
Drawing on the constructed sub-industrial panel data, we further calculate several economic indicators of the 38 sub-industries. To see their varying trends and differences among the sub-industries easily, Figure 1.2 depicts their weighted averaging values for the industry as a whole, and for light and heavy industry, in which the weights are each sub-industrial gross output value and the light and heavy industry are classified in terms of the same criteria as those in Table 1.1.
In Figure 1.2, sub-figure (a) describes the industrial value-added per capita, that is, labour productivity, which is used internationally to assess the industrialization level and measure the economic benefits and production efficiency during the course of industrialization. Obviously, since the mid-1990s, industrial labour productivity has increased rapidly, leading to a continuously rising industrialization level; corresponding with the reappearance of heavy industrialization after 2002, the output per capita in heavy industry even exceeded that in light industry, and the momentum of heavy industrialization still exists currently in China.
Figure 1.2 Trend of main economic indicators for light industry, heavy industry and aggregated industry.
Zhang (2002) utilizes the ratio of capital to output to describe the capital deepening phenomenon in the process of industrialization in China. He finds that the ratio of capital to output reversed the long-run decreasing trend and began to increase in 1994. He argues that this phenomenon is because the speed of capital formation will be finally dominated by the law of diminishing marginal returns and the input factors driven economic growth model will be unsustainable in the long term. Thus, the rising ratio of capital to output could be regarded as the important characteristic of extensive economic growth. Young (1994) also denotes that the excessive capital deepening that pushes economic growth in eastern Asia is not sustainable. However, sub-figure (b) of Figure 1.2 shows a different trend of the ratio of capital to output. That is, the ratio varies very little before 1993 but experiences a decreasing trend after 1995. Li and Zhu (2005) find the same phenomenon and think that the better indicator for estimating the capital deepening is not the ratio of capital to output but that of capital to labour, because the capital deepening implies that more capital and less labour are utilized during the multiple-input-combination production process. Like labour productivity, the ratio of capital to output is in fact the reciprocal of capital productivity. Sub-figure (b) reveals that...