![]()
CHAPTER 1
Conception of Fail-Safe Supply Networks
A network is a set of interconnected entities. Networks permeate many aspects of human endeavor, as evidenced by the structures in education, society, and business, with technological advances catalyzing an unprecedented level of connectivity and dynamic flow. The central problem we address in this monograph is network failure precipitated by various types of risks. To assist in exploring and solving this problem, we focus specifically on supply networks, and recommend architecting Fail-Safe Supply Networks. We investigate two main types of risks that threaten supply networks, namely variations and disruptions and explain at a high level the elements of Fail-safe supply networks: reliability, robustness, resilience, flexibility, and structural controllability. Finally, we provide an overview of the following chapters, wherein we describe each of these elements, culminating with our thoughts on how these models can extend beyond supply networks.
1.1 Introduction: Networks and the Power of Connections
Many scientists consider the cell to be the fundamental building block of life. Human brain cells are connected by structures called synapses; there are between 50 trillion and 100 trillion synapses in the average human brain. In neuroscience, the term livewiring refers to the process of constant modification to the synaptic connections, a process that is essential to the remarkable adaptability of the brain (Eagleman 2015). Similarly, an individual has many abilities; as individuals form family bonds and wider social ties, their physical, mental and monetary capacities also increase. In the same way, the utility of a single medical diagnostic machine is small compared to one that is connected to several databases and physicians, as these connections facilitate the accuracy and rapidity of diagnoses (Ramo 2016). Likewise, a single computer is quite powerful in terms of data storage and computational speed. In contrast, the internet is a collection of interlinked computers, storing several petabytes of data within approximately 75 million servers, and data generated by user interactions are shared between servers through various communication links (Shroff 2013). The above examples demonstrate the power of connections and networks.
A network is a set of interconnected entities. A city with various neighborhoods and schools connected by roads is an example of a physical network. Facebook, by contrast, is a virtual network of social connections. From early examples such as the Roman aqueducts and the trade routes of the Indus Valley civilization, networks have been an integral part of most human activities, and with the passage of time, have grown in strength and scope. For instance, today’s transportation networks span the globe, and communication networks extend into space. The formation and growth of a network expands the role and scope of each entity within the network, as highlighted in the opening examples.
In business, the supplier’s role extending to the supplier’s supplier and the customer’s role extending to the customer’s customer illustrate this phenomenon. This structural expansion presents the need for a clear understanding of the requirements and capabilities of key entities. Network influences such as inter-customer connections, direct supplier to customer connections, and innovation in one industry generating opportunities in others, are transforming traditional business models. The ubiquity of networks has shortened distances, compressed time and spawned innovations. Tata Consultancy Services (TCS), a global leader in digital solutions, has identified the Digital Five Forces: Mobility & Pervasive Computing, Big Data & Analytics, Social Media, Cloud Computing and Artificial Intelligence & Robotics (Krishnan 2017). These technologies facilitate, enable, and expand networks, catalyzing an unprecedented level of connectivity. With the explosive growth of networks, comes the associated need to avoid network failures, where the network does not perform as expected. Consequently, we address network failure as the central problem in this monograph. To assist in exploring and solving this problem, we focus on one type of network, namely the supply network.
1.1.1 Supply Networks
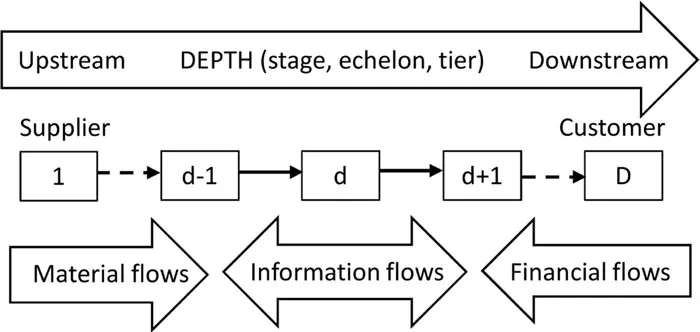
Supply networks are engines of economic development. Most products, ranging from a carton of milk to the latest laptop, are produced through the collaborative effort of many enterprises which form a network. This network that extends from the supplier to the end consumer is called the supply network. The various participants, through their facilities and processes, add value to the product as it passes through the network. Each facility forms a node in the supply network and the path taken by the product between two facilities is called a link. A supply chain is a simple iteration of the supply network, depicted in Figure 1-1. In this figure, each rectangular box represents a facility such as a supplier factory, warehouse, manufacturing plant, distribution center or a retail store. The arrows indicate connections or links between facilities. The number of serial facilities indicates the depth (d) of the supply chain, with each facility representing a stage, echelon or tier.
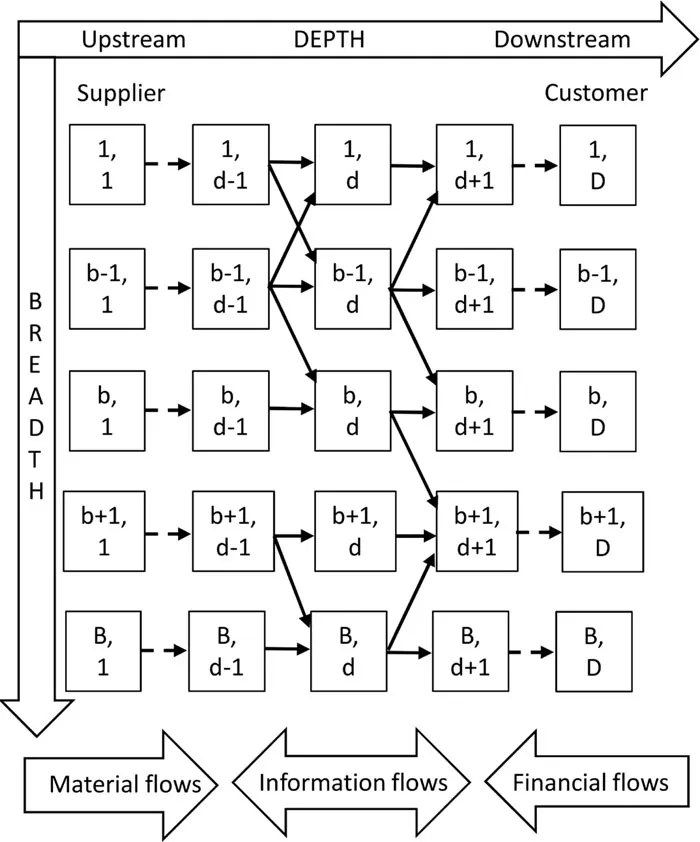
The more generic form of a supply network is depicted in Figure 1-2. In addition to depth, the supply network also has a breadth dimension (b), which indicates the number of facilities in each level. The supply network also has a more complex structure, in terms of the number and arrangement of the facilities, as well as the connections between them. For instance, there can exist alternate paths between two facilities, or the same facility could connect to two other facilities through different paths. It is worth noting that the actual locations of the facilities in a supply network are often spread across the globe. This supply network concept applies to services as well as products.
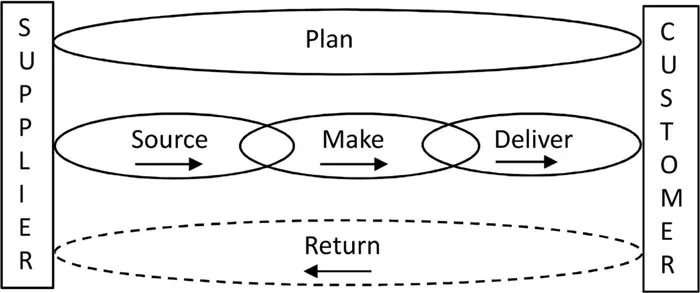
A supply network contains a number of flows: material flows, information flows and financial flows as shown in Figures 1-1 and 1-2 (Tang and Nurmaya Musa 2011). Material flow refers to the movement of raw materials, sub-assemblies and final products within and between facilities; typically, material flows from the supplier to the customer, or upstream to downstream in network terms. Information flow is normally bi-directional and includes demands, purchase orders, inventory status and similar data elements. Financial flows refer to payments, credit terms, contracts and other flows related to money; generally, financial flows take place moving from downstream to upstream. Customers place demands on the distributors and retailers and these demands are fulfilled by a flow of materials from the suppliers to the manufacturers and then to the distributors. The Supply Chain Operations Reference (SCOR) Model abstracts the processes at these facilities (Lockamy III and McCormack 2004; Bolstorff and Rosenbaum 2011) as shown in Figure 1-3. The SCOR model provides a unified structure that connects process models, best practices, performance metrics and people skills. For our purposes, we focus on the processes defined in the SCOR model: Plan, Source, Make, Deliver and Return. These processes are interlinked to facilitate bidirectional flows from the supplier’s supplier to the customer’s customer.
Figure 1-1. Pictorial representation of a supply chain.
Figure 1-2. Pictorial representation of a supply network.
Figure 1-3. The SCOR model.
The SCOR model contains processes at four levels. Level 1 includes the top-level processes, namely, Plan, Source, Make, Deliver and Return; these processes establish the scope and parameters of the supply network. In Level 2, the Level 1 processes are further sub-categorized based on the planning and execution configurations. Level 3 comprises process element level detail; for example, transactions and metrics. Level 4 consists of specific company-level tasks. We limit our attention to the processes in Level 1, as these are the core processes for any supply network.
• Plan: Encompasses all planning processes focused on synchronizing and optimizing activities across the entire supply network. The key is to balance aggregate demand and supply, including available resources.
• Source: Contains processes that procure goods (raw materials, components and finished goods) and services to meet real or anticipated demand; these processes include vendor certification, supplier agreements, inventory management, delivery scheduling, quality control and payment authorization.
• Make: Consists of processes that transform materials into a finished product, or create the means for providing services, to meet planned or actual demand. These processes include manufacturing, testing, packaging, storing and releasing the product, as well as managing equipment, facilities, and transportation.
• Deliver: Comprises processes that provide services and finished goods to meet planned or actual demand; these processes typically include transportation, order management, warehousing, distribution management, invoicing and import/export requirements.
• Return: Includes processes connected to the reverse flow of defective, warranted, or excess products from the customer; these processes include inspection, maintenance, repair, disposition and warranty management. The Return process is an instance of materials flowing from downstream to upstream.
While the SCOR model contains the generic structure of any supply network, depending on the product or service and the type of industry, several derivative structures are possible which manifest as different types of supply networks. For example, an automobile manufacturer has several suppliers, usually in multiple tiers, supplying thousands of different parts to a comparatively limited number of manufacturing plants, where the final products are assembled and sent to distributors. Hur et al. (2004) estimate that 65% of the value added to an automobile is derived from the suppliers. Thus, the automotive supply network is very deep, Source-intensive, and has a converging structure. By contrast, a semiconductor chip manufacturer uses a limited number of raw materials, and in a series of complex manufacturing steps, produces a wide variety of end products. Hur et al. (2004) estimate that more than 50% of the value added in a semiconductor device is attributed to the manufacturing processes, making the semiconductor supply network Make-intensive. This supply network is also deep (though the depth is less than that of an automotive network) and has a diverging structure as the finished products are shipped worldwide.
A retailer’s supply network is different from the automotive and semiconductor networks in that it does not usually contain any Make processes, but is heavily focused on Source and Deliver processes for numerous products. These products are typically supplied by Consumer Packaged Goods (CPG) manufacturers, who have extensive supply chains of their own. Since the products must be delivered to retail stores spread across the map, the retail supply network is shallow (limited depth or number of tiers), but has significant breadth. Other supply network structures, for pharmaceutical, textile, and oil & gas companies, are described by Ivanov and Sokolov (2010). While the aforementioned supply networks belong to commercial companies intent on making a profit, there are also other supply networks that are not motivated by profit. The most common examples of the latter are humanitarian supply networks that bring relief supplies and trained professionals to the sites and victims of a disaster (Cozzolino 2012).
In many of these supply networks, both commercial and humanitarian, the primary objective is to satisfy the demands or needs of customers. There could be secondary objectives like maximizing profit or minimizing carbon footprint; however, maximizing demand satisfaction is of paramount importance and...