- 163 pages
- English
- ePUB (mobile friendly)
- Available on iOS & Android
eBook - ePub
Continuity and Change in the Tunisian Sahel
About this book
The Tunisian Sahel is an extraordinary region for study. A unique and marginal zone in terms of its climate; its relationship to Europe and in its geo-political position as an Arab country in Africa, it provides a fascinating lens through which to study the complex geographical issues of continuity and change. Continuity and Change in the Tunisian Sahel explores just such issues using a number of sub-themes: Islam, the relationships the region has with the global economy, rural development, security, and urban form and function. Based on a well-established fieldwork course, and copiously illustrated with maps, diagrams, photographs, posters, quotations and tables, the book also includes practical advice on how to carry out fieldwork and field investigations in arid and semi-arid regions.
Trusted by 375,005 students
Access to over 1.5 million titles for a fair monthly price.
Study more efficiently using our study tools.
Information
Part One
Geographical Contexts
Chapter 2
Physical Environment
Introduction
The physical environment of Tunisia provides the canvas or backcloth on which continuity and change in a marginal zone are painted. It is particularly the extremes produced by the physical environment that craft the landscape and give a distinctive character to the human geography of the country. This chapter describes the physical environment of Tunisia, including its topography, climate, water, soils and vegetation. The chapter concludes by reviewing the implications of the physical environment of Tunisia for the Sahel zone.
Topography
Tunisia lies at the eastern end of the Saharan Atlas mountains which extend from Morocco, where the Great Atlas reach to over 2500 m, through the plateau region of Algeria to enter Tunisia at the country's western border. Figure 2.1 shows the three main fingers of the Atlas mountains that enter Tunisia: these three fingers are described below.
The Northern Chain of mountains is a continuation of the Atlas Maritime along the northern coast of Tunisia. The mountains are generally above 800 m and the area has the highest rainfall in Tunisia with over 600 mm per annum. The Dorsale (implying fin or back) has an orientation south west to north east from Kasserine to Cap Bon and the Gulf of Tunis. The mountains of the Dorsale reach over 1000 m in altitude and are an important climatic barrier: in winter they prevent incursions of unsettled weather from the wetter north, while in summer they protect the north from the hot, dry scirocco winds from the Sahara desert. The Southern Dorsale Mountains run west to east through Gafsa to the Gulf of Gabes. They are lower than the Dorsale Mountains, but do have some peaks over 1000 m. They are the northern boundary of the Chott El Djerid, a major inland salt lake or sebkha that is dry for most of the year. Together the Southern Dorsale and the Chott El Djerid form a major boundary between the Sahara desert to the south and the rest of Tunisia to the north.
The south of Tunisia, known as the Ksour, is a combination of sand and rock desert. It is largely barren with isolated oases, and has the desert landscapes often termed 'lunar' and made famous in films such as The English Patient and Star Wars.
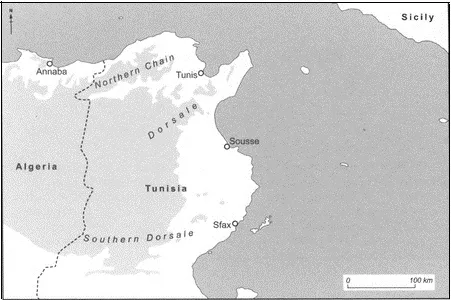
Figure 2.1 The major elements of the Atlas mountains in Tunisia
Climate
Controls on climate
Tunisia is Mediterranean in both location and in climate. The Mediterranean climate is a sub-tropical transition climate, with dry, hot summers and warm/cool, wet winters (Barry and Chorley 1998). The transition in the climate is between sub-tropical high pressure to the south and the westerly airflow and depression tracks to the north. Tunisia's annual climate can be characterised by a transition from a stable summer climate dominated by sub-tropical high pressure to an unstable winter climate characterised by northerly incursions of cool, wet weather.
Figure 2.2 shows schematically the general circulation of the atmosphere. During the summer months of May to October Tunisia falls under the descending limb of the Hadley cell, producing stable weather with clear blue skies, high daytime temperatures (often above 30°C) and low rainfall. The descending limb of the Hadley cell therefore makes a significant contribution to the Tunisian tourist industry by producing hot, sunny weather, although it also produces conditions of high evapotranspiration and extensive water loss.
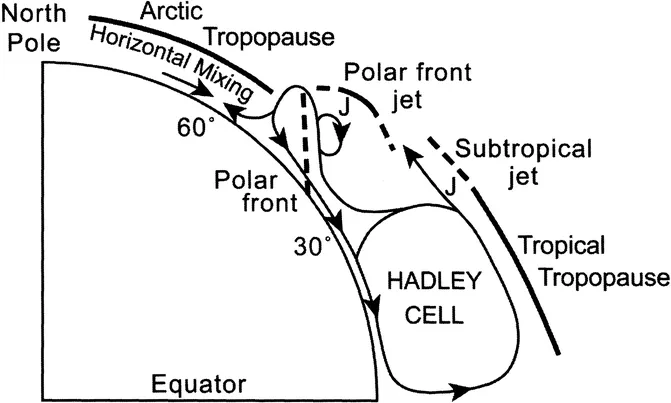
Figure 2.2 The general circulation of the atmosphere Source: adapted from Barry and Chorley 1998
The period November to April is from time to time influenced by mid-latitude depressions that bring incursions of unsettled weather from Europe. Temperatures fall to around 10°C, often accompanied by strong winds, leaden skies and several days of rain. In the winter the Mediterranean Sea is relatively warm, which enhances depressions because of the land/sea temperature contrast. However, the winter months also often have stable weather conditions with clear blue skies and temperatures of around 15°C, the winter sun of holiday brochures.
Low pressure cells
Some of the extreme weather events in Tunisia are caused by low pressure cells migrating through the Mediterranean region. Depending on their position and their track, low pressure cells can bring winds from any compass point, for example southerly winds from the Sahara desert or north easterlies from the Eurasian land mass. Scirocco winds (see Figure 2.3a) develop when a deep low pressure cell travels eastward through the western basin of the Mediterranean and draws in air ahead of it. The winds originate in the Sahara desert and so are hot, dry and very dusty. They can dessicate crops, produce rapid evaporation from open water and make breathing difficult.
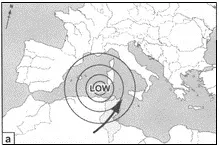
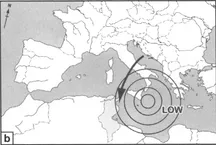
Figure 2.3 The role of low pressure cells in producing weather extremes in Tunisia
By contrast, cold and wet winds from the north and north east can occur where a low pressure cell travels through the eastern basin of the Mediterranean and draws air behind it (see Figure 2.3b). Figure 2.4 shows the swirl of cloud between Italy and Tunisia on a NO A A weather satellite image indicating an active low pressure cell in the central Mediterranean Sea region on 8 November 1999, drawing cold, moist air from eastern Europe to Tunisia. Such air flows can be, for Tunisia, exceptionally cold. In January 1981 a Mediterranean low pressure cell drew in air over Tunisia that had originated in Siberia; this cold air flow brought snow to Sousse for the first time since 1947 and temperatures of less than 5°C for several days.
Regional climates
Rainfall and temperature maps of Tunisia (see Figure 2.5) show a generally west-east orientation of isolines, indicating in turn a north-south change of climate conditions. The Northern Region has rainfall above 400 mm per annum, much of it orographically induced or enhanced by the Northern Chain mountains and the Dorsale Mountains. The Northern Region is the most agriculturally productive region of the country because of its high annual rainfall; the area accounts, for example, for over 70 per cent of Tunisia's cereal production. The Central Region is a triangular shaped area lying between the Dorsale Mountains to the north and the Southern Dorsale to the south. This region, the main focus of this book, has rainfall between 200 and 400 mm per annum, and mean annual temperatures of around 19°C with maxima up to 45°C during the summer. The Southern Region is south of a latitude line through Gafsa with rainfall of only 100 to 200 mm per annum and very high summer temperatures (see Figure 2.5). The region is very thinly populated because of the hot, arid conditions: the oasis of Tozeur for example has a mean July maximum temperature of 39.1 °C and a mean July rainfall of zero.
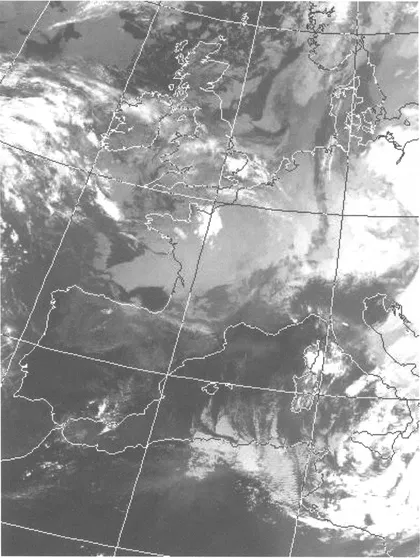
Figure 2.4 A NOAA AVHRR satellite image of part of North Africa and Europe, 8 November 1999 (15.15 hours, thermal infrared channel 11.5-12.5μe swirl of cloud between Italy and Tunisia indicates a low pressure cell, drawing northerly winds from eastern Europe over Tunisia)
Source: Dundee Satellite Receiving Station
Source: Dundee Satellite Receiving Station
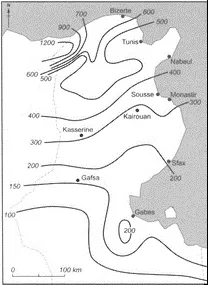
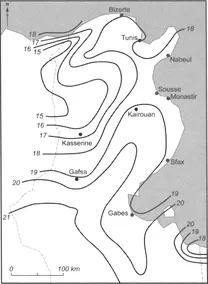
Figure 2.5 Mean annual rainfall (left hand map, units are mm) and mean annual temperature (right hand map, units are °C) for Tunisia, 1901-1960
Rainfall variability and water availability
One characteristic of rainfall in Tunisia is its high variability, which can place great stress on agriculture and on domestic water supplies. The mean annual rainfall in Sousse is 320 mm, but yearly totals have ranged from 179 mm to 525 mm, that is from totals representative of the desert south through to totals representative of the wetter north with its extensive and productive agriculture. Much of the rainfall in the Central and Southern Regions is very intense, and when combined with dry soils can lead to soil erosion, particularly shortly after crops are harvested. The centre and south of Tunisia is therefore at a climatic disadvantage compared to the wetter north, a disadvantage that is likely to increase with predicted climate change during the 21st century.
The results of models of climate change and the work of the Intergovernmental Panel on Climate Change (IPCC 2001) suggest that over the course of the 21st century the climate of Tunisia will become hotter and drier. This will place even greater pressures on agriculture and on domestic water availability in Tunisia. Table 2.1 shows the actual water availability per capita in 1990 and that projected for 2025 for Tunisia and for other North African countries. A report by the US National Research Council (1999) notes that 500 m3 per person per year might suffice in a semi-arid society with sophisticated water management systems: Tunisia was on the border of 500 m3 per person per year in 1990 and will be well below this threshold by the year 2025 if predicted climate change occurs.
Table 2.1 Per capita water availability for countries in North Africa in 1990 and projected for 2025
| Country | Water availability per capita in 1990 m3 /person/year | Projected water availability per capita in 2025 m3 /person/year |
|---|---|---|
| Algeria | 750 | 380 |
| Libya | 160 | 60 |
| Morocco | 1200 | 680 |
| Tunisia | 530 | 330 |
Source: Gleick 1992 cited in National Research Council 1999
Box 2.1 Temperature, precipitation and climate change
Based on research work at the Climatic Research Unit of the University of East Anglia it is possible for the first time to summarise the temperature and precipitation for Tunisia as a whole. The data in this box were taken from the Climatic Research Unit (2002) which has created data sets that have been approved by the Intergovernmental Panel on Climate Change. Meteorological station data were assimilated on a grid of 0.5° latitude/longitude for the whole globe and country values extracted from the grid cells that fall within a country: Mitchell et al (2002) describe the process and the gridded data sets are described in New et al (1999).
The following diagram shows the annual average temperature for Tunisia for the period 1901-1998 together with a moving average using an 11 year window. The mean temperature for the series is 18.8°C. There is a clear trend of increase in temperature from around 18°C at the start of the 20th century through to tem...
Table of contents
- Cover
- Half Title
- Title
- Copyright
- Contents
- List of Boxes
- List of Figures
- List of Tables
- Acknowledgements
- Part 1 Geographical Contexts
- Part 2 Continuity and Change in the Sahel
- References
- Index
Frequently asked questions
Yes, you can cancel anytime from the Subscription tab in your account settings on the Perlego website. Your subscription will stay active until the end of your current billing period. Learn how to cancel your subscription
No, books cannot be downloaded as external files, such as PDFs, for use outside of Perlego. However, you can download books within the Perlego app for offline reading on mobile or tablet. Learn how to download books offline
Perlego offers two plans: Essential and Complete
- Essential is ideal for learners and professionals who enjoy exploring a wide range of subjects. Access the Essential Library with 800,000+ trusted titles and best-sellers across business, personal growth, and the humanities. Includes unlimited reading time and Standard Read Aloud voice.
- Complete: Perfect for advanced learners and researchers needing full, unrestricted access. Unlock 1.5M+ books across hundreds of subjects, including academic and specialized titles. The Complete Plan also includes advanced features like Premium Read Aloud and Research Assistant.
We are an online textbook subscription service, where you can get access to an entire online library for less than the price of a single book per month. With over 1.5 million books across 990+ topics, we’ve got you covered! Learn about our mission
Look out for the read-aloud symbol on your next book to see if you can listen to it. The read-aloud tool reads text aloud for you, highlighting the text as it is being read. You can pause it, speed it up and slow it down. Learn more about Read Aloud
Yes! You can use the Perlego app on both iOS and Android devices to read anytime, anywhere — even offline. Perfect for commutes or when you’re on the go.
Please note we cannot support devices running on iOS 13 and Android 7 or earlier. Learn more about using the app
Please note we cannot support devices running on iOS 13 and Android 7 or earlier. Learn more about using the app
Yes, you can access Continuity and Change in the Tunisian Sahel by Ray Harris in PDF and/or ePUB format, as well as other popular books in Physical Sciences & Geography. We have over 1.5 million books available in our catalogue for you to explore.