Index-tracking is the flavour of the day - it accounts for around one-third of the total US mutual fund market, and is still growing rapidly. Indexing appears to be unstoppable.But, in The End of Indexing, investment veteran Niels Jensen presents a different vision. In a forthright and compelling examination of the investment landscape, Jensen argues that the economic environment we are entering will be unsuited to index-tracking strategies.Jensen identifies six structural mega-trends that are set to disrupt investors around the globe:1. End of the debt super-cycle2. Retirement of the baby boomers3. Declining spending power of the middle classes4. Rise of the East5. Death of fossil fuels6. Mean reversion of wealth-to-GDPIn conjunction, these six themes have the potential to create conditions resembling a perfect storm that will result in low economic growth for decades to come. Investment techniques and methodologies - including passive investing strategies - that have worked so well in the bull market of the last 35 years will no longer deliver acceptable results.As a new investment approach is called for, The End of Indexing provides investors with a guide to the challenging environment ahead and a warning about the future decline of index-tracking.
eBook - ePub
The End of Indexing
Six structural mega-trends that threaten passive investing
- English
- ePUB (mobile friendly)
- Available on iOS & Android
eBook - ePub
About this book
Trusted by 375,005 students
Access to over 1.5 million titles for a fair monthly price.
Study more efficiently using our study tools.
Information
1. The Declining Everything
The world we wake up to every morning is so different from the one many of us grew up in. Take inflation – something that in my childhood was as certain as the sun rising every morning; however, you cannot take it for granted anymore. Come to think of it, there are many things you cannot take for granted anymore. I look at why that is or, at the very least, I begin to scratch the surface in my search for answers.
Why we are slowing down
Everything4 is slowing down. Economic growth is in a multi-decade decline. Productivity growth is losing momentum, and has even turned negative in some countries. The same goes for workforce growth. Inflation turned into disinflation at first but, more recently, the F-word of economics – deflation – has popped up in more and more countries.
What on earth is going on?
Ever since the Global Financial Crisis nearly took us all down, financial commentators and research analysts have spent a lot of time trying to explain to a puzzled financial community why economic growth remains pedestrian, why inflation is so low, and why interest rates are stuck in the quicksand.
An endless flow of research papers has addressed the subject, collectively blaming many causes. I shall not list every single reason I have come across over the years; suffice to say that the following six reasons – or some variety of those – probably cover most that I have seen:
1. A statistical mirage
Argument: There isn’t a problem. Smartphones replacing cameras, etc., underestimate actual economic growth.
2. A hangover from the Global Financial Crisis
Argument: Severe financial crises make recovery from a downturn even more difficult.
3. Secular stagnation
Argument: Reduced population and workforce growth, lower prices for capital goods, and the nature of recent innovations (e.g. online shopping replacing brick and mortar shops) all hold back economic growth.
4. Slower innovation
Argument: The pace of innovation has declined; almost everyone now benefits from the things that matter the most to productivity – e.g. electricity and transportation – and recent innovations are more marginal in nature in terms of economic benefits.
5. Policy missteps
Argument: An increase in government spending combined with tax hikes (which is a policy pursued by many governments in recent years) has had a strong negative impact on private investment spending.
6. Abusive behaviour
Argument: Abuse of market power, monopoly status, etc., have contributed to the slowdown in wages and output.
None of those six suggestions provide a satisfactory explanation for the stagnation conundrum, though. They have all played a role – some more than others – but not one deserves to be credited as the main reason.
The facts
To fully understand what is going on, I suggest you take a good look at the following four exhibits (1.1.1–1.1.4). As you can see, GDP growth, in both nominal and real terms, productivity growth and inflation have all trended down for a very long time – by most accounts since the 1970s – so something very fundamental must be astray.
Exhibit 1.1.1: Nominal GDP growth by decade (compound annual growth rate, CAGR)
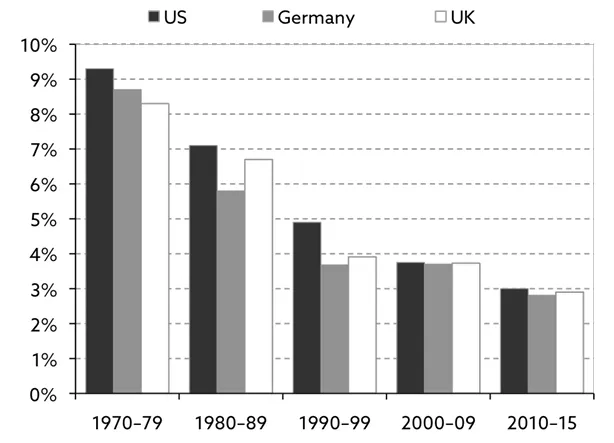
Exhibit 1.1.2: Real GDP growth by decade (CAGR)
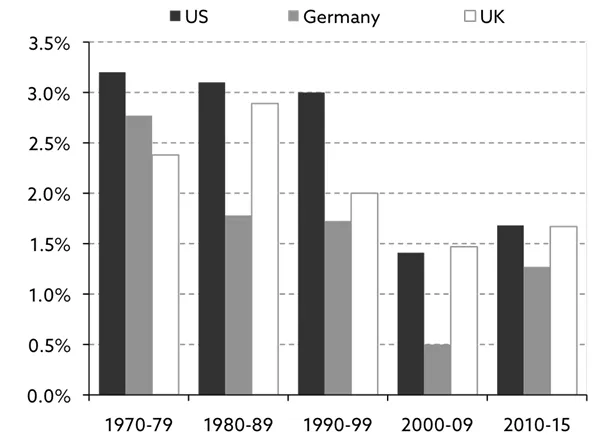
Exhibit 1.1.3: GDP growth per hour worked by decade (CAGR)
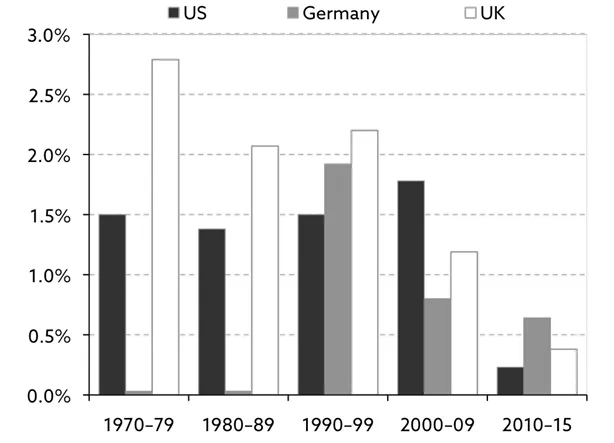
Exhibit 1.1.4: Average annual inflation by decade (CPI)
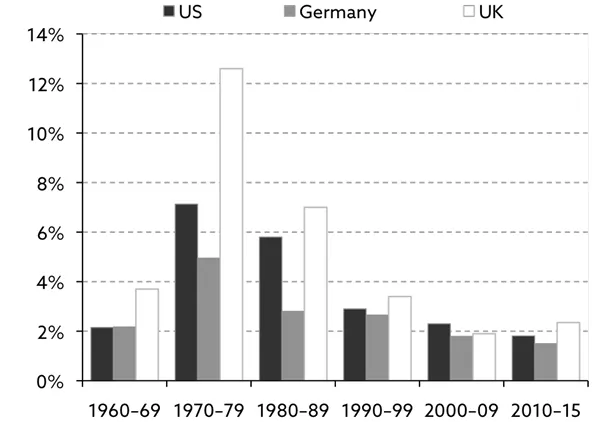
Source: Strategic Economic Decisions (2016).
A very simple way to measure GDP growth
Let’s begin our journey with something very basic.
What is it that drives economic growth?
At the most fundamental level, economic growth is driven by only two factors – the total number of hours worked on an aggregate basis and the output per hour, the latter of which is effectively a measure of how productive the workforce is.
There are no reliable statistics for the total number of hours worked, but thankfully the workforce put in roughly the same number of hours from one year to the next, so the size of the workforce5 is a good proxy for the number of hours worked. The relationship can be expressed as follows:
∆GDP = ∆Workforce + ∆Productivity
JP Morgan Asset Management has tracked how much the two components have contributed to GDP growth in the US over the last 60 years (exhibit 1.2)6 and, as one can see, US workforce growth has been in decline since the mid-1980s.
Meanwhile, productivity growth, as measured in exhibit 1.2, confirms the picture from exhibit 1.1.3, i.e. that the decline in productivity growth is of more recent date. Both of those charts are based on labour productivity, which is the measure of productivity that most focus on; however, there is a problem. Labour productivity will rise sharply if sufficient money is spent on new machines, but that doesn’t necessarily improve overall economic efficiency.
Consequently, the concept of total factor productivity (TFP) was conceived. It is calculated as the percentage increase in output that is not accounted for by the changes in the volume of inputs of capital and labour. In other words, TFP is a measure of what share of increased productivity can be explained by factors other than growth in labour or capital.
Over the past half century, almost two-thirds of the growth in TFP can be explained by technology improvements. It is a better proxy for an economy’s return on capital, but it wouldn’t be fair to simply replace labour productivity with TFP. They are two very different measures of productivity. Furthermore, and as you will see over the coming chapters, declining TFP g...
Table of contents
- Contents
- Praise for The End of Indexing
- About the Author
- Acknowledgements
- Preface
- Introduction
- 1. The Declining Everything
- 2. The Big Conundrum
- 3. The End of the Debt Super-Cycle
- 4. The Retirement of the Baby Boomers
- 5. The Declining Spending Power of the Middle Classes
- 6. The Rise of the East
- 7. The Death of Fossil Fuels
- 8. Mean Reversion of Wealth-to-GDP
- 9. The Perfect Storm
- 10. How to Improve Productivity
- 11. What’s Next?
- 12. Why Index Investing Will Dwindle
- Bibliography
Frequently asked questions
Yes, you can cancel anytime from the Subscription tab in your account settings on the Perlego website. Your subscription will stay active until the end of your current billing period. Learn how to cancel your subscription
No, books cannot be downloaded as external files, such as PDFs, for use outside of Perlego. However, you can download books within the Perlego app for offline reading on mobile or tablet. Learn how to download books offline
Perlego offers two plans: Essential and Complete
- Essential is ideal for learners and professionals who enjoy exploring a wide range of subjects. Access the Essential Library with 800,000+ trusted titles and best-sellers across business, personal growth, and the humanities. Includes unlimited reading time and Standard Read Aloud voice.
- Complete: Perfect for advanced learners and researchers needing full, unrestricted access. Unlock 1.5M+ books across hundreds of subjects, including academic and specialized titles. The Complete Plan also includes advanced features like Premium Read Aloud and Research Assistant.
We are an online textbook subscription service, where you can get access to an entire online library for less than the price of a single book per month. With over 1.5 million books across 990+ topics, we’ve got you covered! Learn about our mission
Look out for the read-aloud symbol on your next book to see if you can listen to it. The read-aloud tool reads text aloud for you, highlighting the text as it is being read. You can pause it, speed it up and slow it down. Learn more about Read Aloud
Yes! You can use the Perlego app on both iOS and Android devices to read anytime, anywhere — even offline. Perfect for commutes or when you’re on the go.
Please note we cannot support devices running on iOS 13 and Android 7 or earlier. Learn more about using the app
Please note we cannot support devices running on iOS 13 and Android 7 or earlier. Learn more about using the app
Yes, you can access The End of Indexing by Niels Jensen in PDF and/or ePUB format, as well as other popular books in Business & Financial Accounting. We have over 1.5 million books available in our catalogue for you to explore.