The foreign exchange market is huge, fascinating and yet widely misunderstood by participants and non-participants alike. This is because its unanswered questions are numerous. For instance, what is the purpose of the $4 trillion per day trading volume? What determines currency trends and who are the players in the FX arena? Does FX drive other financial markets, or is it the passive end-product of all the other markets? FX is without clear supply and demand factors, so how do traders determine sentiment and price direction?Much is written in an effort to answer these questions, but a lot of it is just noise. In the 12 pieces here, Barbara Rockefeller and Vicki Schmelzer draw on their combined 50 years' experience in foreign exchange to cut through the clutter and provide an elegant and razor-sharp look at this market. Their analysis is accurate, useful and enlivened by many anecdotes and examples from historic market events. They cover:- How the matrix concept can help observers understand foreign exchange market action- What professional FX traders take into consideration before entering into positions- Whether the FX market can be forecast- The interplay between foreign exchange and other financial markets- How technology has levelled the playing field between big and small players, and at what cost- Whether the prospect of reserve currency diversification away from the dollar is likely- The toolkit that central banks use to manage national economies and the effect of this on currencies'The Foreign Exchange Matrix' is the go-to book for anyone seeking a deeper understanding of the world of foreign exchange.
eBook - ePub
The Foreign Exchange Matrix
A new framework for understanding currency movements
- 250 pages
- English
- ePUB (mobile friendly)
- Available on iOS & Android
eBook - ePub
The Foreign Exchange Matrix
A new framework for understanding currency movements
About this book
Trusted by 375,005 students
Access to over 1.5 million titles for a fair monthly price.
Study more efficiently using our study tools.
Chapter 1 – The Matrix Concept
“I do not believe such a quality as chance exists. Every incident that happens must be a link in a chain.”
Benjamin Franklin
What is the matrix?
The FX Matrix refers to a grid format of the multiple factors and players in the FX market and the way they interact. The term matrix is borrowed from random matrix theory and we use the matrix concept as a metaphor to help you avoid reaching or accepting oversimplified explanations of why the market behaves the way it does.
In random matrix theory, the maths is truly advanced. Graduate students, hedge funds and governments devise models of complex dynamic systems. Most of us can’t get past page one of their articles and books because of the daunting calculations, but the metaphor is helpful to get a general grasp of the idea. In finance, random matrix theory was borrowed from physics and used to do things like remove idiosyncratic noise from correlation studies in designing optimum portfolios, leading to better estimates of component risk. The factor modelling includes weighting endogenous variables, exogenous variables and unobserved factors, and measuring their vectors.
Most relevant to the FX market today is estimating effects like sovereign risk contagion. Central bankers, including the Federal Reserve, are avid practitioners. [1] As the European Monetary Union (EMU) grapples with bank capital adequacy and sovereign credit issues, it’s a pretty good assumption that European economists are using matrix theory, too.
The 2008 failure of Lehman Brothers (considered a local behaviour) jumped the boundaries of its own (large) matrix and became a universal factor independent of the pre-existing probability distributions of the other matrices. In the vernacular, a falling tide lowers all boats. But we want to know whether the factors involved in the Lehman failure (including the behaviour of the US government) were random noise to the FX market, or an exogenous factor (out of left field), or maybe an endogenous (inherent) factor in the FX matrix. Some correlations are, after all, just coincidence. Millions of random correlations exist in the financial world. We want to know how much weight to give Big Financial Institution Failure and Government Refusal to Intervene in the FX matrix.
Lehman Brothers declared bankruptcy on 15 September 2008. Before then, the rumour mill was already active with word of the bankruptcy. We heard of European banks closing lines to Lehman several months before the final collapse. Lehman wasn’t the only factor in the FX market, but consider the trajectory of the dollar index. It had bottomed in March 2008 (at 70.698) and put in a second low in July (71.314) but then rose to 80.375 by 11 September. Over the next week, encompassing the Lehman debacle, the dollar index fell to what turned out to be an intermediate low of 75.891 on 22 September. The index then rose to a high of 88.463 by late November. The dollar’s rise was a surprise to those FX players accustomed to selling the currency of a country in trouble. The dollar’s use as a safe-haven trumped the negativity of Lehman’s bankruptcy and therefore gave the safe-haven status more weight in the matrix.
The dollar index was already on the upswing when Lehman went bankrupt and the sell-off on the actual bankruptcy news was very short-lived; only one week. Smart FX analysts were detecting that overall financial market risk aversion was in play over the summer of 2008 and the dollar kept rising. The Lehman bankruptcy in hindsight was an exogenous shock, mostly because it was inconsistent with our assumptions about how the US government behaves and how the financial sector had behaved in the past. Up until the very last minute, some observers expected a bailout like the one of Long-Term Capital in 1998, and a return to risk positioning. But once the news was digested, the FX market returned to its previous mode of shunning risk. At that time (and up to the S&P downgrade of the US sovereign rating in August 2011), to be risk averse was to buy the safe-haven dollar.
Why the matrix is useful
The Lehman case is an example of a factor from a relatively distant corner of the FX matrix wending its way to FX prices themselves via interbank liquidity and interest rates, coupled with a major change in perception of the banking sector and US government – the Establishment. We would normally not expect an exogenous variable like the bankruptcy of a single financial institution to have such broad-reaching effects. It remains a puzzle why the rumours of the bankruptcy and then the event itself caused such an exaggerated reaction among international investors, sending them rushing to the safe-haven dollar.
The Lehman bankruptcy marks a dividing line in FX history between a time when price determinants encompassed an already wide range of factors to a new period in which price determinants range even more widely and reach into even more unexpected corners. This is why the concept of risk appetite and risk aversion is so useful – today, just about any exogenous variable has the potential to fly over the standard cause-and-effect factors and land on FX.
In the next sections of this chapter, we see examples of the new power of exogenous variables in FX. Pre-Lehman, for example, a popular uprising in an emerging market seldom had any effect on FX prices. But in 2011, regime change in North Africa had a pro-dollar effect, but in limited and varying ways. The effect of the Egyptian change differed from the effect of the change in Libya, in part because of Libya’s role as an oil producer and the presence of foreign military forces. The addition of geopolitical events to the universe of FX determinants through the medium of risk appetite/risk aversion has made the FX world a vastly more complicated place in just a few years.
We now have to enter into consideration issues to which we used to give little thought, such as what will happen to oil prices if and when the current Venezuelan leader Chavez leaves office? We can suppose that the oil market will respond but we do not know whether a resulting rise or fall in oil prices will be correlated with the dollar – or the euro. The matrix helps us to make sense of all these interconnecting strands and thus of the FX market.
The primitive matrix
When an economist sits down to map out a hierarchy of fundamental factors that determine exchange rates, he may come up with something like Table 1.1. For each exchange rate on the left, the factors that affect it can in theory be checked off to reach an understanding of what affects that rate. Note that the factor list is incomplete – we could add dozens of other fundamentals such as labour market flexibility, tax rates, etc.
Table 1.1 – fundamental factors
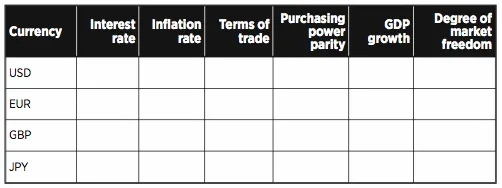
But if an economics-minded trader tries to apply incoming data to real-time trading, very quickly he discovers that economic fundamentals are sadly insufficient to explain FX price action – you also need the institutional context, as in the Lehman case and European sovereign risk contagion in 2009-2011. So now we need the mindset of political economy (as it was named in the 19th century). Table 1.2 shows how this grid might look.
Table 1.2 – institutional factors
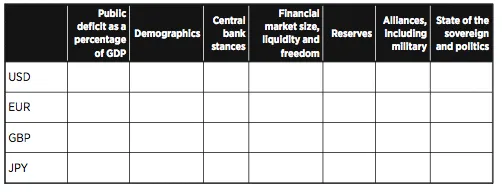
For example, the European Central Bank (ECB) famously has a single mandate – to maintain price stability – whereas the US Federal Reserve has an additional mandate, to promote employment. In addition, as the issuer of the reserve currency, the US has a unique responsibility to lend to other central banks in time of crisis. Meanwhile, the euro is a currency without a state, which circles around to public deficits and to several factors in the economic factors spreadsheet, like the terms of trade.
Just when the analyst is trying to figure out how to combine the two sets of factors, he realises something else is missing, and it’s big – the goals and attitudes of the FX market players themselves. In this grid (Table 1.3) it’s the players that are on the y-axis rather than the currencies.
Table 1.3 – market player factor
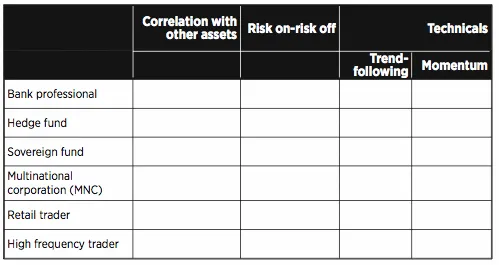
In short, the fundamentals matrix introduced first doesn’t include all the factors you need to analyse the FX market, and by the time you add institutional factors and market player factors, you need a three-dimensional matrix more like a Rubik’s cube than a spreadsheet.
No sooner can you fix on a matrix like the one above than something will come along and show its inadequacy, if only because financial markets evolve. China opened a gold and precious metals commodity futures exchange in 2011, and is exploring reserve diversification not only in other currencies, especially the euro, but also in the form of bigger equity investments at the expense of US Treasury and Agency paper. European peripherals may default on sovereign debt, an event that has never happened in quite the same way throughout all history because we never before had a currency union quite like the EMU. So even if you build a system for analysing the FX market, you have to be prepared for it to be out of date, or for a factor you didn’t think to take account of to occur, quite soon.
As for two-dimensional charts that appear to illustrate that Factor X is highly correlated with Currency Outcome Y and must be causative, this is often misleading. Two-dimensional charts are deceptive – correlation is not always causation, and worse, they result in emphasis on outcomes instead of processes. The salient question in FX analysis is in fact: how do traders rank various multiple variables and events to determine whether they want to buy or sell a currency?
Charts in two dimensions lack explanatory power and analytical depth – they don’t enable us to answer the question just posed. Worse, they are static. It would be nice to be able to display interactive, dynamic effects, but that would take video, and even then it’s not clear we could see cause-and-effect clearly.
We can try another matrix. Along one axis are the players in the FX market and along the other axis are the factors that influence FX prices. The grid should be imagined like a standard spreadsheet so that a big change in one cell is transmitted to other cells.
For example, we know that not only current interest rate differentials influence FX traders and investors, but also interest rate expectations. When a big change in expectations arises, as when Federal Reserve Chairman Bernanke announced in August 2010 that a second round of quantitative easing was pending, it dominates the market. When news of this magnitude is released we can grey out all the other variables on the matrix until bigger news about a key factor comes along. Because the graphic process is not a dynamic one, we need to prepare additional matrices and throw away the old ones as conditions change.
As a practical matter, you could combine and simplify to produce a master matrix that looks something like the one shown in Table 1.4.
Table 1.4 – combined master matrix
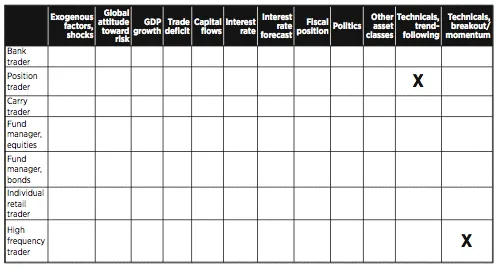
The two Xs mark the primary factors for just two types of FX market participants, the position trader and the high-frequency trader. The position trader, which includes the deep pockets of sovereign wealth funds and hedge funds (as well as hedgers from the equity and bond markets), will probably analyse the market using trend-following technicals, while high-frequency traders will use short-term breakout and momentum technicals. They may be on opposite sides of the same trade. Fund managers, whether of money market instruments, stocks or bonds, may have their antennae tuned to GDP growth and capital flows, while the carry trader cares about only thing; the stability of interest rate differentials.
The matrix process
We are still missing an important component, namely the weights to attach to each player and his favoured factor, and the vec...
Table of contents
- Cover
- Publishing details
- About the Authors
- Foreword
- Introduction
- Chapter 1 – The Matrix Concept
- Chapter 2 – Review of Risks
- Chapter 3 – Global Attitude Toward Risk
- Chapter 4 – Interest Rates and Interest Rate Differentials
- Chapter 5 – Forecasting FX
- Chapter 6 – Positions and Flows
- Chapter 7 – Intermarket Analysis
- Chapter 8 – Technical Analysis in Foreign Exchange
- Chapter 9 – The FX Files of Trading
- Chapter 10 – Be Careful What You Wish For: Reserve Diversification and the Future of the Dollar
- Chapter 11 – The Euro and the New Gold Standard
- Chapter 12 – The Central Bank Tool Kit and How it Affects Foreign Exchange
Frequently asked questions
Yes, you can cancel anytime from the Subscription tab in your account settings on the Perlego website. Your subscription will stay active until the end of your current billing period. Learn how to cancel your subscription
No, books cannot be downloaded as external files, such as PDFs, for use outside of Perlego. However, you can download books within the Perlego app for offline reading on mobile or tablet. Learn how to download books offline
Perlego offers two plans: Essential and Complete
- Essential is ideal for learners and professionals who enjoy exploring a wide range of subjects. Access the Essential Library with 800,000+ trusted titles and best-sellers across business, personal growth, and the humanities. Includes unlimited reading time and Standard Read Aloud voice.
- Complete: Perfect for advanced learners and researchers needing full, unrestricted access. Unlock 1.5M+ books across hundreds of subjects, including academic and specialized titles. The Complete Plan also includes advanced features like Premium Read Aloud and Research Assistant.
We are an online textbook subscription service, where you can get access to an entire online library for less than the price of a single book per month. With over 1.5 million books across 990+ topics, we’ve got you covered! Learn about our mission
Look out for the read-aloud symbol on your next book to see if you can listen to it. The read-aloud tool reads text aloud for you, highlighting the text as it is being read. You can pause it, speed it up and slow it down. Learn more about Read Aloud
Yes! You can use the Perlego app on both iOS and Android devices to read anytime, anywhere — even offline. Perfect for commutes or when you’re on the go.
Please note we cannot support devices running on iOS 13 and Android 7 or earlier. Learn more about using the app
Please note we cannot support devices running on iOS 13 and Android 7 or earlier. Learn more about using the app
Yes, you can access The Foreign Exchange Matrix by Barbara Rockefeller,Vicki Schmelzer in PDF and/or ePUB format, as well as other popular books in Business & Stocks. We have over 1.5 million books available in our catalogue for you to explore.