Brian J. Millard uses channel analysis to determine how certain share price cycles, made up of both random movement and predictable cyclical movement, should behave in the near future, giving the investor a powerful prediction tool.A considerable proportion of price movement is random and as such, investors cannot achieve 100% success in predicting price movement. However, cycles are present in share price data, and channel analysis can be used to determine their position.Channel analysis enables investors to:- Rapidly scan a pool of 50-100 shares for new opportunities- Identify the start and end of trends only a few days after the event- Use one of three stop-loss methods as added insurance against extreme random movementsThe author also discusses how probability analysis allows the investor to attain a better estimation of channel turning points, leading to greater profit potential. 'Millard on Channel Analysis' is an invaluable guide for any investor who wants to make money by looking at share price cycles.
- 232 pages
- English
- ePUB (mobile friendly)
- Available on iOS & Android
eBook - ePub
About this book
Trusted by 375,005 students
Access to over 1.5 million titles for a fair monthly price.
Study more efficiently using our study tools.
Chapter 1. Buy and Hold?
There has always been a difference of opinion between those investors who believe that the best policy is to buy a share and then virtually forget it and those investors who believe that better profits can be made by constant forays in and out of the market. Market professionals obviously belong to the latter category, since they appear to spend their whole day engaged in buying and selling operations. During the privatisations of British Telecom, British Gas, the water and electricity companies, etc., many amateur investors came to the conclusion that the best profit was the quick profit that could be made by selling the shares within a few days of issue, and therefore they took the same view as the professionals. However, if we look at the vast majority of investors in the privatisation issues, we find that they have no clear objective. They firmly believe that the share price will rise consistently over the foreseeable future, and have no inclination to sell unless sudden demands for capital are made on them. In other words, for most of these investors, their selling action will be dictated by personal circumstances and not the behaviour of the share price itself.
This view of buying shares and then holding on to them for long periods of time has much to commend it: it makes no demands on the investor in terms of having to manage the various shares that go to make up the investor’s portfolio, and it has resulted in good profits for most of the quality shares over the last 15 years or so. Looking at this statement more closely will lead to the conclusion that this buy and hold policy makes no demands on the investor simply because good profits have been made in most shares. If shares had been much more mixed in their long-term performance then it would have been necessary for investors to have taken a much more active stance. The fallacy in most investors’ reasoning is therefore that share prices will inexorably rise in the future if a long-term, say 10- or I5-year view, is taken. This long-term view can even accommodate drastic crashes in the market such as occurred in October 1987. On this long-term view, most falls in the market can be accepted merely as blips in the steady upwards progress, the October crash being just a slightly larger blip than has been the norm since 1929. We shall see later in the discussion on cycles in the market that the rise we have seen over the last 15 years cannot continue forever, and that once the very long-term cycles start to reach their peaks, then the long-term rise will turn into a long-term fall.
GAINS AND COMPOUND GAINS
Before we can proceed any further with a discussion of the merits of different investment strategies, we have to get clear in our minds the various ways in which we can calculate and compare gains (or losses) in investment capital. The most common way of calculating a gain is to express it as a percentage change from the starting value. Thus if an investor starts with £1000 and turns it into £2000 over a certain period of time then quite obviously he has made a gain of 100%. A different way of expressing the gain is to consider it as a factor by which the starting amount has to be multiplied. In this present example the investor has doubled his money, and therefore the gain factor is 2. If we deal with numbers that are not so round, then for example an investor turning £1000 into £1450 over a period of time will have made a gain of 45%, while the gain factor is 1.45. In this chapter we will be using both gain factors and percentage gains. It is easy to convert from percentages to gain factors and vice versa by the simple formulas:
Gain factor = (100 + percentage gain)/100
and
percentage gain = 100 x (gain factor - 1)
Now, of course, a gain in capital becomes meaningless without a timescale attached to it. An investor A who makes 100% on his starting capital over five years has not done as well as an investor B who makes the same gain in four years. The best way of comparing the two performances is to express them as gains (either gain factors or percentage gains will do) over the same time period, which in this case would conveniently be a year. One simple way of doing this would be to divide the total gain by the number of years. We would then find that investor A who doubled his money over five years would have made a gain of 20% per annum and investor B who took four years to do this would have made a gain of 25% per annum. The disadvantage of calculating gains in this way is that it ignores the ability to compound gains, i.e. to plough back into the next investment the total proceeds from the previous investment, both the original stake and any gain made from it. Throughout this chapter we will be adopting this approach of calculating gains as compound gains, i.e. as if they were made annually and reinvested.
Although such compound gains can be calculated from the percentage gain made each year, it is much easier to calculate them if we use gain factors, since we simply multiply the gain factors together to get the overall gain.
As an example, if we make a gain of 11% per annum, then this is the same as a gain factor of 1.11. To compute the gain over a number of years, say five, we simply multiply the gain factors together the number of times that we have years.
Thus 1.11 compounded for five years = 1.11 x 1.11 x 1.11 x 1.11 x 1.11
= (1.11)5
= 1.685
By our formula above, a gain factor of 1.685 is a percentage gain of 68.5% over five years. Note the difficulty of calculating the above if we tried to use percentages instead of gain factors. Scientific and financial calculators have a key which is usually labelled x y which makes this calculation easier than multiplying the numbers together the requisite number of times. In this case x is the gain factor, e.g. 1.11, and y is the number of years.
If the gains differ for each of the five years, then we still use the above method, but replace the value of 1.11 for that year by the appropriate gain factor. We cannot then use the x y key on the calculator, of course, since the x values are not all the same.
On a computer using BASIC, the line which gives the compounded gain, say G, from the annual gain, say A, is:
G=A^Y
where Y is the number of years.
Having shown how to compute an annual gain into a five-year gain, for example, we have to do the reverse of this to express the five-year gains of investors A and B as annual gains. Each of them made gains of 100%, i.e. gain factors of 2.0. Thus,
annual gain = 5th root of 2.0 for investor A
= 1.149
annual gain = 4th root of 2.00 for investor B
= 1.189
Thus if the gain is known for an n-year period, the annual gain is the nth root of this n-year gain. The problem with reducing a gain to a gain over a shorter time period is that most simple calculators only have square roots, and not nth roots. Some financial and all scientific calculators will have this facility, which is performed by a key which is usually labelled x 1/y. In this case, x is the overall gain factor and y would be the number of years, or whichever period it is desired to reduce the gain to. With a computer, to get the annual gain A from a gain of G which has been obtained over a period of Y years there is a oneline program in BASIC using the EXP and LOG functions:
A = EXP(LOG(G)/Y)
BUY AND HOLD FOR A LONG TERM
The correctness of the buy and hold strategy can appear to be confirmed by a chart of just about all shares that have been quoted for a 15-year period on the London stock market. As just one example, the chart of Grand Metropolitan is shown in Figure 1.1. Taking the extremes of the chart, an investor could have bought Grand Met shares at 52p on 6th January 1978 and sold them on 31st January 1995 at 464p. If dealing costs are ignored, this represents a profit of 412p per share, i.e. a profit of 792% on the initial price.
Figure 1.1 The Grand Metropolitan share price since 1978
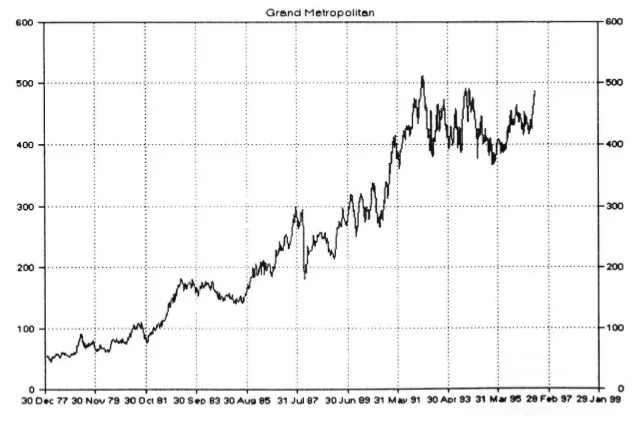
Unfortunately, dealing costs cannot be ignored, and the small investor suffers more than most as far as the level of costs is concerned. For the sake of argument, if we assume that a parcel of 1000 shares was purchased at 52p, then the dealing costs on such an amount would be approximately 2.5%. The selling costs would be approximately 1.5%. These percentages increase rapidly as the value of the deal falls below £1000 and decrease only slowly as the deal moves into the tens of thousands of pounds.
Thus the dealing costs of buying 1000 shares at 52p would be about £13 and the selling costs of selling at 464p would be about £69. Now we can calculate a more realistic profit for the entire deal than the 792% we noted above:
Buy 1000 shares at 52p Outlay = £520 + £13 = £533
Sell 1000 shares at 464p Receipts = £4640 - £69 = £4571
Actual gain = £4038
This represents a gain of 757% on the outlay of £533. Therefore the dealing costs of this transaction have reduced the overall gain by some 35% over the 18-year period.
If we are going to make this a realistic exercise, then there is one important aspect that is missing from this calculation. This concerns the dividends that would have been paid during the 18-year period for which the shares would have been held. To simplify matters, we can consider that Grand Metropolitan consistently paid a 5% dividend, year in and year out over this period.
Since the average share price was halfway between 52p and 464p, i.e. 258p, we can estimate the cumulative dividend as:
18 x 1000 x 258p x 5% = £2322
This increases the actual gain from £4250 as calculated without dividends to £6572 with dividends. This now gives a gain of 1233% on the initial outlay of £533.
Since we require some standard timescale over which to compare the gain from one situation with the gain from another, it is best to state this gain from investment in Grand Metropolitan shares as a percentage gain per annum. As we discussed above, it is not correct simply to divide the 1233% by 18 and use this as the annual gain. The annual gain has to be such that it compounds into a gain of 1233% over the 18-year period, so that we could compare it with that made by an investor who leaves his money and the accumulated interest in an interest-bearing account. If we do this, we find that the gain of 1233% equates to a gain of 15.5% per annum. This is superior to any gain that could have been made by depositing the money in the money market for one-year periods, year in and year out, and so appears to verify that long-term investment in shares is an excellent strategy.
The profit from the position is made because...
Table of contents
- Cover
- Publishing details
- Preface to this Edition
- Preface to the First Edition
- Chapter 1. Buy and Hold?
- Chapter 2. The Nature of Share Price Movement
- Chapter 3. Trends in Share Prices
- Chapter 4. Isolating Trends from Complex Movements
- Chapter 5.Predicting Future Movement
- Chapter 6. The Cycles Present in Share Price Data
- Chapter 7. The Relationship between Moving Averages and Channels
- Chapter 8. Turning Points in Share Prices
- Chapter 9. Maintaining a Pool of Shares
- Chapter 10. Staying Disciplined
- Appendix
Frequently asked questions
Yes, you can cancel anytime from the Subscription tab in your account settings on the Perlego website. Your subscription will stay active until the end of your current billing period. Learn how to cancel your subscription
No, books cannot be downloaded as external files, such as PDFs, for use outside of Perlego. However, you can download books within the Perlego app for offline reading on mobile or tablet. Learn how to download books offline
We are an online textbook subscription service, where you can get access to an entire online library for less than the price of a single book per month. With over 1.5 million books across 990+ topics, we’ve got you covered! Learn about our mission
Look out for the read-aloud symbol on your next book to see if you can listen to it. The read-aloud tool reads text aloud for you, highlighting the text as it is being read. You can pause it, speed it up and slow it down. Learn more about Read Aloud
Yes! You can use the Perlego app on both iOS and Android devices to read anytime, anywhere — even offline. Perfect for commutes or when you’re on the go.
Please note we cannot support devices running on iOS 13 and Android 7 or earlier. Learn more about using the app
Please note we cannot support devices running on iOS 13 and Android 7 or earlier. Learn more about using the app
Yes, you can access Millard on Channel Analysis by Brian Millard in PDF and/or ePUB format, as well as other popular books in Business & Stocks. We have over 1.5 million books available in our catalogue for you to explore.