The Life Cycle Hypothesis provides evidence of an ordered process behind the apparent randomness of financial asset price movements, economic fluctuations, and social trends. It shows how genuine information will have a dramatic effect on any system into which it is inserted, and will generate reactions that are essentially pre-programmed.These reactions involve the processes of advance and decline, and therefore embrace a set of specific lower-order fluctuations. Financial and economic analysts have long been familiar with the resulting phenomena, but have had difficulty providing a satisfactory explanation. The Life Cycle Hypothesis builds on the findings of Tony Plummer's previous book, The Law of Vibration, and shows that nature itself contains the answer. There is a universal blueprint that manages growth, that organises evolution, and that contends with decline.In effect, the shock of fresh information creates a new organism whose energy travels along a natural pathway between birth and death. It is this pathway that generates such widely diverse phenomena as personal mid-life crises, the swarming of innovations, recurring patterns in financial markets, and rhythmic oscillations in national economies. It is this pathway that produced the Great Depression of the 1930s, the inflation trauma of the 1970s, and the global financial crisis of 2007-08. The same pathway now suggests that there may be a major global crisis in the early years of the next decade. The Life Cycle Hypothesis has the potential to change the way that we understand the world. It will therefore have a natural appeal for investors, economists, and social scientists. It will also be of great interest to those who sense a connection between the diverse social and political upheavals that are currently impacting us, and who want to understand the forces at work.
eBook - ePub
The Life Cycle Hypothesis
Groundbreaking new research into the regular rhythms and recurring patterns that underpin financial markets, the economy and human life
- English
- ePUB (mobile friendly)
- Available on iOS & Android
eBook - ePub
The Life Cycle Hypothesis
Groundbreaking new research into the regular rhythms and recurring patterns that underpin financial markets, the economy and human life
About this book
Trusted by 375,005 students
Access to over 1.5 million titles for a fair monthly price.
Study more efficiently using our study tools.
Information
1. William Gann’s Hidden Pattern
Introduction
In the early years of the 2010s decade, I discovered that the legendary stock market trader, William Delbert Gann, had concealed a pattern within the first edition of his famous 1927 book, The Tunnel Thru The Air (hereafter Tunnel).5 The full details of how I found the pattern, and deduced its historical lineage, are contained in my 2013 book, The Law of Vibration.6 Those details will not, therefore, be presented here.
The essential point is that Mr Gann concealed the pattern instead of simply revealing it. The book hides a great deal of other information, not the least of which concerns the influence on financial markets of the golden ratio, 38.2:61.8, of the musical octave ratio, 50:100, and of planetary cycles. I shall address the role of the golden ratio and the influence of the musical octave ratio in Appendix II. I shall not, however, be venturing too deeply into the fields of astrology and astronomy.7 I shall briefly address the role of planetary cycles in Chapter 4, in the context of the human life cycle; otherwise, my intention is to leave the subject to those who know what they’re talking about.8
Meanwhile, we need to know what Mr Gann’s pattern actually looks like, so that we can analyse its behavioural implications.
The pattern
The first edition of Tunnel consists of 418 pages, and spans 36 chapters.9 As a piece of literature it is (for this reader, anyway) tediously long and not particularly engaging. It is full of seemingly irrelevant poems and inappropriate quotations – especially from the Bible. This, however, turns out to be a clue, because variations in the text are used as a method of controlling the number of pages in any given chapter. The number of pages per chapter varies significantly, from a low of four to a high of 30. Within the context of the story itself, there is often no obvious reason for variations.
Figure 1-1 plots the number of pages in each chapter against the relevant chapter number. The vertical axes, measuring the number of pages per chapter, start at ‘1’ and end at ‘30’. The horizontal axes, registering the actual chapter numbers, run from ‘1’ to ‘36’. It is immediately obvious that the relationship between pages and chapters is not random. There is an obvious low in the 18th chapter, which means that it is halfway through the pattern. Each half consists of a three-wave advance followed by a three-wave contraction. And the absolute high is in the 12th chapter,10 which is one-third of the way through the pattern.
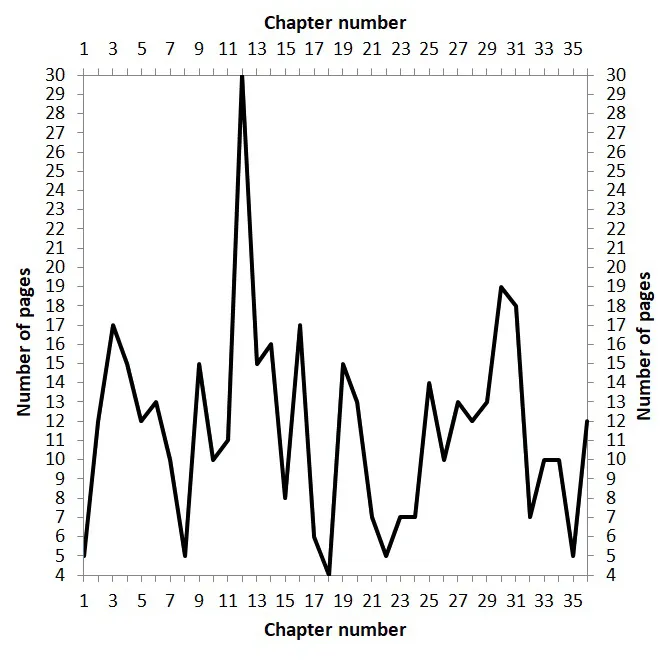
Figure 1-1: William Gann’s hidden pattern of vibration
We can tease more information out of this extraordinary pattern by making a series of adjustments to the presentation. First, we can extend the vertical axes so that they run from 0 to 36. This adjustment makes it clear that the pattern can be contained within a square (see Figure 1-2). If we draw a 45-degree line from the bottom left-hand corner of the diagram to the top right-hand corner, the square is complete where 36 pages are equal to 36 chapters – that is, where the book finishes. It is relevant that Mr. Gann used 36 chapters to achieve this effect.
The number 36 is – among other things – almost certainly a reference to the idea of a completed process. If the numerals within the number 36 are separated out into ‘3’ and ‘6’, and then added together, the result is ‘9’ (i.e., 3 + 6 = 9). In esoteric numerology – which Mr Gann persistently used – the number 9 is the number of completion.11 Coincidentally, the number 36 is also a reference to the 360 degrees of a circle. In this way, Mr Gann was able simultaneously to reference a complete process, a square, and a circle.12 The use of a 45-degree line means, of course, that the square is also complete where 35 pages are equal to 35 chapters. The rise in the number of pages in the last chapter – Chapter 36 – implies that a new pattern is starting.
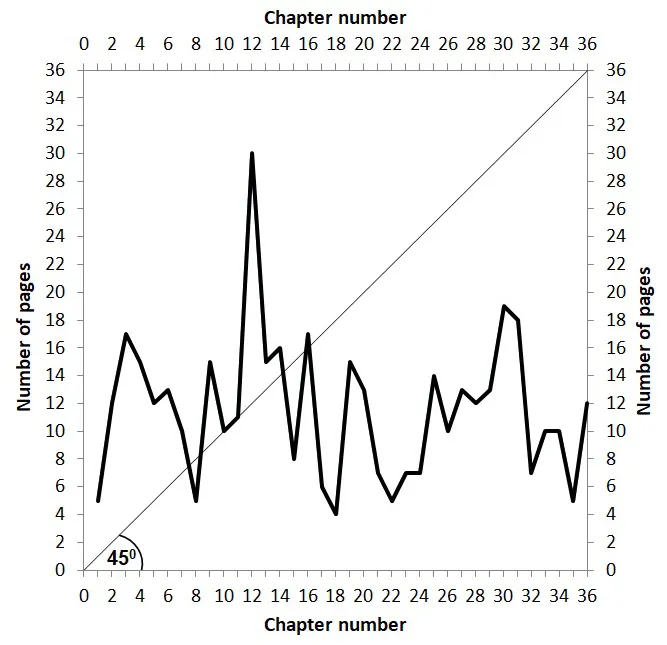
Figure 1-2: The pattern of vibration within a square
Initial interpretations
We can now add simple notations to the diagram in order to highlight the relationships between the waves. In the first set of notations, the first (rising) phase of the diagram is denoted 1-2-3; the subsequent (falling) section is marked A-B-C; and the fluctuations within the (rising) wave B are designated a-b-c. See Figure 1-3.
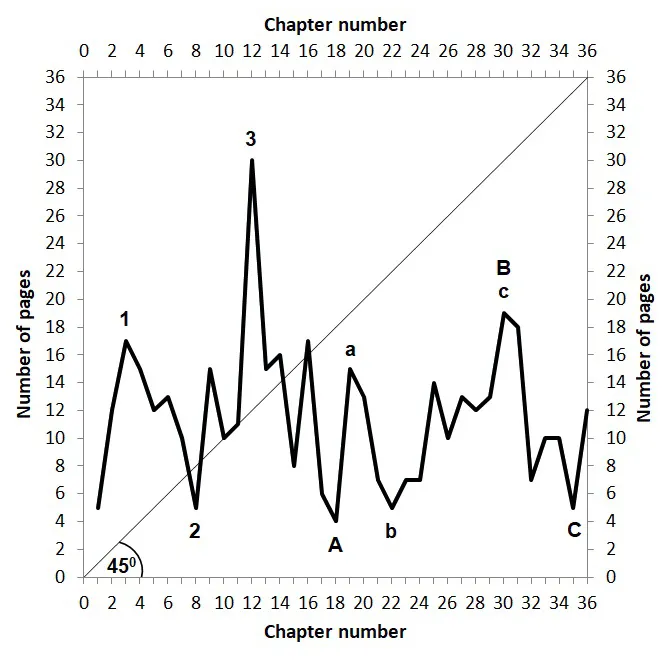
Figure 1-3: Advance and contraction
In this formation, the diagram represents a strong three-wave advance (i.e., 1-2-3), followed by an extended three-wave correction (i.e., A-B-C). Within the correction, the rising wave has three phases (i.e., a-b-c). This emphasises that movements are cyclic in the sense that each advance is followed by a contraction. It also emphasises that the process is ordered because: (a) each movement consists of three waves; and (b) the advancing phase is one-third of the whole cycle, and the contracting phase is two-thirds of that cycle.
The alternative set of notations is shown in Figure 1-4. Here, the diagram is divided into two parts, consisting of 18 chapters each. The major rising waves to the left and right of the centre point are denoted 1-2-3; the sub-waves within those rising waves are denoted i-ii-iii; and each rising wave is followed by a three-phase fall, with the sub-waves denoted A-B-C.
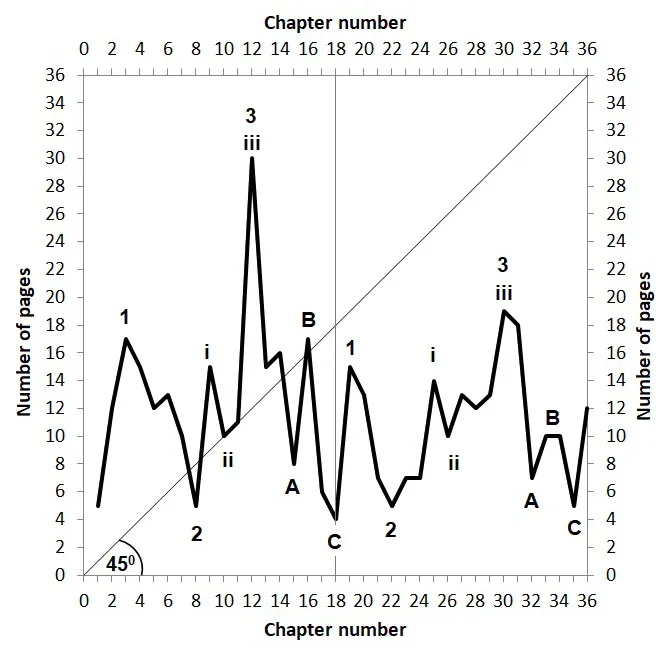
Figure 1-4: The duality of the diagram
In this formulation, the diagram reveals the presence of two very similar oscillations consisting of an extended three-wave advance (1-2-3) followed by a very sharp three-wave contraction (A-B-C). Moreover, each advance-and-contraction takes half of the diagram. If the two halves of the diagram are overlaid on each other, it is possible to make direct comparisons. See Figure 1-5.
In bo...
Table of contents
- Contents
- About the author
- Acknowledgements
- Preface
- 1. William Gann’s Hidden Pattern
- 2. The Symbolic Enneagram
- 3. The Life Cycle Hypothesis
- 4. The Human Life Cycle
- 5. Cyclical Behaviour
- 6. The Life Cycle In US Equities, 1907–74
- 7. The Life Cycle In US Equities, 1970–Present
- 8. Lower-Level Life Cycles
- 9. The 36-Year Cycle In Industrial Production
- 10. The Era Of The Great Depression
- 11. 10-Year US Treasury Notes
- 12. The 54-Year Kondratyev Price Cycle
- 13. The Future Of The Euro
- 14. The Pattern Of Innovation
- 15. West And East
- 16. A Summing Up
- Appendix I. The Circle Of Nines
- Appendix II. Critical Ratios
- Appendix III. Data For Innovation
- Appendix IV. The S-Shaped Learning Cycle
Frequently asked questions
Yes, you can cancel anytime from the Subscription tab in your account settings on the Perlego website. Your subscription will stay active until the end of your current billing period. Learn how to cancel your subscription
No, books cannot be downloaded as external files, such as PDFs, for use outside of Perlego. However, you can download books within the Perlego app for offline reading on mobile or tablet. Learn how to download books offline
Perlego offers two plans: Essential and Complete
- Essential is ideal for learners and professionals who enjoy exploring a wide range of subjects. Access the Essential Library with 800,000+ trusted titles and best-sellers across business, personal growth, and the humanities. Includes unlimited reading time and Standard Read Aloud voice.
- Complete: Perfect for advanced learners and researchers needing full, unrestricted access. Unlock 1.5M+ books across hundreds of subjects, including academic and specialized titles. The Complete Plan also includes advanced features like Premium Read Aloud and Research Assistant.
We are an online textbook subscription service, where you can get access to an entire online library for less than the price of a single book per month. With over 1.5 million books across 990+ topics, we’ve got you covered! Learn about our mission
Look out for the read-aloud symbol on your next book to see if you can listen to it. The read-aloud tool reads text aloud for you, highlighting the text as it is being read. You can pause it, speed it up and slow it down. Learn more about Read Aloud
Yes! You can use the Perlego app on both iOS and Android devices to read anytime, anywhere — even offline. Perfect for commutes or when you’re on the go.
Please note we cannot support devices running on iOS 13 and Android 7 or earlier. Learn more about using the app
Please note we cannot support devices running on iOS 13 and Android 7 or earlier. Learn more about using the app
Yes, you can access The Life Cycle Hypothesis by Tony Plummer in PDF and/or ePUB format, as well as other popular books in Business & International Business. We have over 1.5 million books available in our catalogue for you to explore.