Supertiming: The Unique Elliott Wave System
eBook - ePub

Supertiming: The Unique Elliott Wave System

Keys to anticipating impending stock market action

Robert C. Beckman

Share book
  1. English
  2. ePUB (mobile friendly)
  3. Available on iOS & Android
eBook - ePub

Supertiming: The Unique Elliott Wave System

Keys to anticipating impending stock market action

Robert C. Beckman

Book details
Book preview
Table of contents
Citations

About This Book

The classic work on Elliott Wave and market cycles returned to printDuring the 1930s, R. N. Elliott undertook the painstaking procedure of attempting to classify share price movements for the preceding 80 years on Wall Street. It was during the course of this seminal work that Elliott discovered a definable basic rhythm in share price movements which he felt had forecasting value when correctly applied.In 1938 Elliott published his findings in a series of articles with the overall title "The Wave Principle". After publication, Elliott's work drifted into obscurity, until Robert Beckman's 'Supertiming' introduced it to a new audience.In this renowned work, Beckman sets out with three main objectives: 1. To clarify obscurities and grey areas of The Wave Principle that were present in Elliott's original writing.2. To incorporate the work of other analysts in order to allow the Wave Principle to have a broader application.3. To show the correct conceptual approach that should be used with the Wave Principle so that one can apply it with confidence and consistency.If you are willing to approach the subject of stock market behaviour with an open mind, who have faith in the fundamental laws of economics and the consistency of human nature, and who would like to avoid the pitfalls that have deluded the investment community for decades, this is the book for you.

Frequently asked questions

How do I cancel my subscription?
Simply head over to the account section in settings and click on “Cancel Subscription” - it’s as simple as that. After you cancel, your membership will stay active for the remainder of the time you’ve paid for. Learn more here.
Can/how do I download books?
At the moment all of our mobile-responsive ePub books are available to download via the app. Most of our PDFs are also available to download and we're working on making the final remaining ones downloadable now. Learn more here.
What is the difference between the pricing plans?
Both plans give you full access to the library and all of Perlego’s features. The only differences are the price and subscription period: With the annual plan you’ll save around 30% compared to 12 months on the monthly plan.
What is Perlego?
We are an online textbook subscription service, where you can get access to an entire online library for less than the price of a single book per month. With over 1 million books across 1000+ topics, we’ve got you covered! Learn more here.
Do you support text-to-speech?
Look out for the read-aloud symbol on your next book to see if you can listen to it. The read-aloud tool reads text aloud for you, highlighting the text as it is being read. You can pause it, speed it up and slow it down. Learn more here.
Is Supertiming: The Unique Elliott Wave System an online PDF/ePUB?
Yes, you can access Supertiming: The Unique Elliott Wave System by Robert C. Beckman in PDF and/or ePUB format, as well as other popular books in Business & Stocks. We have over one million books available in our catalogue for you to explore.

Information

Year
2014
ISBN
9780857193834
Subtopic
Stocks

Appendix: “The Wave Principle”

By R. N. Elliott
Original Publisher’s Note:
DURING THE PAST seven or eight years, publishers of financial magazines and organizations in the investment advisory field have been virtually flooded with “systems” for which their proponents have claimed great accuracy in forecasting stock market movements. Some of them appeared to work for a while. It was immediately obvious that others had no value whatever. All have been looked upon by THE FINANCIAL WORLD with great scepticism. But after the investigation of Mr. R. N. Elliott’s Wave Principle THE FINANCIAL WORLD became convinced that a series of articles on this subject would be interesting and instructive to its readers. To the individual reader it is left the determination of the value of the Wave Principle as a working tool in market forecasting, but it is believed that it should prove at least a useful check upon conclusions based on economic considerations.
The Editors of The Financial World

Introducing “The Wave Principle”

Since the beginning of time, rhythmic regularity has been the law of creation. Gradually man has acquired knowledge and power from studying the various manifestations of this law. The effects of the law are discernible in the behaviour of the tides, the heavenly bodies, cyclones, day and night, even life and death! This rhythmic regularity is called a cycle.

Historical Significance

The first great advance in the scientific application of the law was made in the time of Columbus by Leonardo da Vinci in his illuminating study of the behavior of waves. Other great men followed with special applications: Halley with this comet, Bell with sound waves, Edison with electrical waves, Marconi with radio waves, and still others with waves of psychology, cosmic waves, television, etc. One thing in common that all these waves or forms of energy have is their cyclical behavior or ability to repeat themselves indefinitely. This cyclical behavior is characterized by two forces – one building up and the other tearing down. Today Hitler is said to be timing his conquests in accordance with this natural law as interpreted in the movement of the stars – but the destructive forces are accumulating and at the proper time will become dominant – completing the cycle.
Because of this phenomenon of repetition or rhythmic recurrence, it is possible to apply the lesson learned from other manifestations of the law in a very practical and profitable way. The trade cycle and the bull and bear movements of the stock market are also governed by the same natural law. Some fifty years ago Charles Dow through his observations of the important changes in the stock market gradually built up the Dow Theory, which now is accepted in many quarters as having special forecasting significance. Since Dow’s studies, the store of information regarding market transactions has been greatly multiplied, and important and valuable new forecasting inferences can be drawn from certain behavior.
Through a long illness the writer had the opportunity to study the available information concerning stock market behavior. Gradually the wild, senseless and apparently uncontrollable changes in prices from year to year, from month to month, or from day to day, linked themselves into a law-abiding rhythmic pattern of waves. This pattern seems to repeat itself over and over again. With knowledge of this law or phenomenon (that I have called the Wave Principle) it is possible to measure and forecast the various trends and corrections (minor, intermediate, major and even movements of a still greater degree) that go to complete a great cycle.
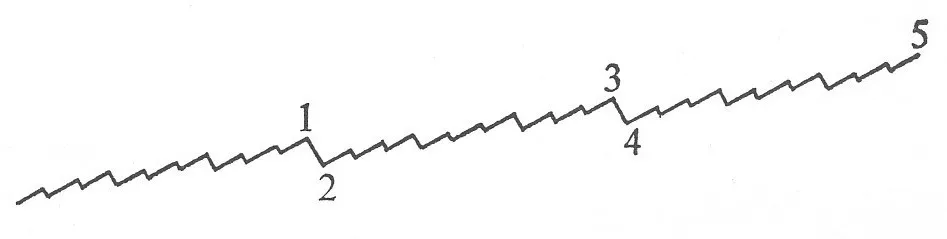
Figure 1
This phenomenon is disclosed in Figure 1. The full wave or progressive phase of the cycle consists of five impulses: three moving forward and two moving downward. Waves 1, 3 and 5 are in the direction of the main trend. Wave 2 corrects Wave 1 – and Wave 4 corrects Wave 3. Usually the three forward movements are in approximately parallel planes; this may also be true of Waves 2 and 4.
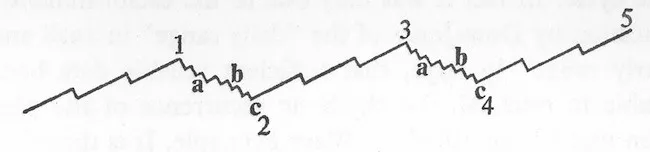
Figure 2
Each of the three primary waves that together make a completed movement is divided into five waves of the next smaller or intermediate degree. This subdivision is shown in Figure 2. Note carefully that there are five smaller or intermediate waves making up the Primary Wave 1, five in Primary Wave 3, and five in Primary Wave 5. The Primary Wave 2 corrects the completed Primary Wave 1 consisting of five intermediate waves; Wave 4 in turn corrects the five intermediate waves that make up Primary Wave 3.
Figure 3
Each intermediate forward wave is in turn divided into five minor waves as shown in Figure 3. When the fifth minor wave of the fifth intermediate phase of the fifth primary movement has spent its force, a formidable top has been constructed. Upon completion of a movement of this magnitude, the destructive forces become dominant; the primary trend turns downward and a bear market is in progress long before the economic, political or financial reasons for the change in outlook are clearly apparent.

The Wave Principle: Part II

In the preceding discussion of the Wave Principle as applied to the forecasting of stock price movements, it was pointed out that a completed movement consists of five waves, and that a set of five waves of one degree completes the first wave of the next higher degree. When Wave 5 of any degree has been completed, there should occur a correction that will be more severe than any previous correction in the cyclical movement.

Completed Movement

The rhythm of the corrective phases is different from that of the waves moving in the direction of the main trend. These corrective vibrations, or Waves 2 and 4, are each made up of three lesser waves, whereas progressive waves (1, 3 and 5) are each composed of five smaller impulses. In Figure 4, the completed movement is shown, being identical to Figure 3 except that Waves 2 and 4 of the “zigzag” pattern are shown in greater detail. These Waves 2 and 4 are thus shown to consist each of three component phases but as these two waves are also “completed movements”, they are also characterized by five-wave impulses; that is the “a” and “c” phases (the first and third movements of the correction) are also each composed of five smaller waves, while “b” (the correction of the correction) is composed of three lesser waves. This question of corrections will require more extended discussion later on, as some forms and types are so complicated in structure that their presentation at this stage might be confusing.
Figure 4
The student using the Wave Principle to forecast price changes does not require confirmation by a companion average, inasmuch as the Principle applies to individual stocks, to various groups (steel, rails, utilities, coppers, oils, etc.), and also to commodities and the various “averages”, such as those of Dow-Jones, Standard Statistics, New York Times, New York Herald Tribune, the Financial Times of London, etc. At any given time it will be found that some stocks are advancing and others are declining; but the great majority of individual stocks will be following the same pattern at the same time. It is for this reason that the wave pattern of the “averages” will correctly reflect the cyclical position of the market as a whole. The larger the number of stocks in an average, the more sharply outlined the wave impressions will be. This means that if stocks are widely distributed among a large number of individuals, the response to cyclical influences will be registered more definitely and rhythmically than if the distribution is limited.

Price Ranges Used

No reliance can be placed on “closings”, daily or weekly. It is the highest and lowest ranges that guide the subsequent course of the cycle. In fact it was only due to the establishment and publication by Dow-Jones of the “daily range” in 1928 and of “hourly range” in 1932, that sufficient reliable data became available to establish the rhythmic recurrence of the phenomenon that I have called the Wave Principle. It is the series of actual “travels” by the market, hourly, daily and weekly, that reveal the rhythmic forces in their entirety. The “closings” do not disclose the full story, and it is for this reason (lack of detailed data) that the phase-by-phase course of the London stock market is more difficult to predict than the New York market.
The complete measurement of the length of a wave is therefore its continuous travel between two corrections of the same or greater degree. The length of a wave of the lowest degree is its travel in one direction without any sort of correction even in the hourly record. After two corrections have appeared in the hourly record, the movement then enters its fifth and last stage, or third impulse. So-called “resistance” levels and other technical considerations have but little value in forecasting or measuring the length or duration of these waves.

Outside Influences

As the Wave Principle forecasts the different phases of a cycle, the experienced student will find that current news or happenings, or even decrees or acts of government, seem to have but little effect, if any, upon the course of the cycle. It is true that sometimes unexpected news or sudden events, particularly those of a highly emotional nature, may extend or curtail the length of travel between corrections, but the number of waves or underlying rhythmic regularity of the market remains constant. It even seems to be more logical to conclude that the cyclical derangement of trade, bringing widespread social unrest, is the cause of wars, rather than that cycles are produced by wars.

The Wave Principle: Part III

Because, after the Fifth Wave of an advancing movement has been completed, the correction will be more severe than any yet experienced in the cycle, it is desirable to determine beforehand where the top of this wave will be. With such knowledge, the investor can take necessary steps to assume a defensive policy and convert profits into cash under the most favourable market conditions. He will also be in a strong position to repurchase with confidence when the correction has run its course.
The previous article stated that “The complete measurement of the length of a wave is therefore its continuous travel between two corrections of the same or greater degree.” By repeatedly measuring the length of these waves as they develop, under a method known as channelling, it is possible to determine at the time of completion of Wave 4 approximately where Wave 5 should “top”.
Figure 5 shows a normal completed movement or “cycle”, in which Waves 1, 3 ...

Table of contents