Tramline Trading
eBook - ePub

Tramline Trading

A practical guide to swing trading with tramlines, Elliott Waves and Fibonacci levels

John Burford

Share book
  1. English
  2. ePUB (mobile friendly)
  3. Available on iOS & Android
eBook - ePub

Tramline Trading

A practical guide to swing trading with tramlines, Elliott Waves and Fibonacci levels

John Burford

Book details
Book preview
Table of contents
Citations

About This Book

A straightforward, winning trading methodThere are certain universal chart patterns that are traced out time and time again by markets - these patterns have stood the test of time and can be instantly recognised by a skilled trader. When you learn how to spot these patterns and use them to forecast market action you have the basis of a winning trading method. Tramline Trading is a complete practical guide that shows you precisely how to do this.The Tramline Trading Method described here is a simple and complete system which combines Fibonacci levels, basic Elliott Wave Theory and John Burford's original tramline concepts. It is based on a small number of highly reliable patterns and can be put to use in any market. Every detail of how to put the method into practice is revealed, including how to spot developing patterns for high-probability, low-risk trades, where to place entry orders and stop losses, and the five best setups to look out for. Full colour chart illustrations are used throughout.As well as describing the method in full detail, John Burford also provides day-by-day trading diaries for four-month trading campaigns in gold and the Dow. These invaluable diaries show the mind of the trader as he surveys real-time market action and provide vital insight into how the trading method is used in real trading.If you are looking for a proven trading method that is reliable and easy to execute then Tramline Trading will put you on the right track. It is the essential new guide to a winning trading approach.

Frequently asked questions

How do I cancel my subscription?
Simply head over to the account section in settings and click on “Cancel Subscription” - it’s as simple as that. After you cancel, your membership will stay active for the remainder of the time you’ve paid for. Learn more here.
Can/how do I download books?
At the moment all of our mobile-responsive ePub books are available to download via the app. Most of our PDFs are also available to download and we're working on making the final remaining ones downloadable now. Learn more here.
What is the difference between the pricing plans?
Both plans give you full access to the library and all of Perlego’s features. The only differences are the price and subscription period: With the annual plan you’ll save around 30% compared to 12 months on the monthly plan.
What is Perlego?
We are an online textbook subscription service, where you can get access to an entire online library for less than the price of a single book per month. With over 1 million books across 1000+ topics, we’ve got you covered! Learn more here.
Do you support text-to-speech?
Look out for the read-aloud symbol on your next book to see if you can listen to it. The read-aloud tool reads text aloud for you, highlighting the text as it is being read. You can pause it, speed it up and slow it down. Learn more here.
Is Tramline Trading an online PDF/ePUB?
Yes, you can access Tramline Trading by John Burford in PDF and/or ePUB format, as well as other popular books in Betriebswirtschaft & Aktien. We have over one million books available in our catalogue for you to explore.

Information

Year
2014
ISBN
9780857194343
Subtopic
Aktien
Edition
1

Part 1: The Tramline Trading Method

Chapter 1: My Charting Methods

In this chapter I will review some of the basic concepts in charting and explain how I use them with my favourite chart patterns to uncover great trade setups. The chapter has four sections:
  1. Support and resistance
  2. Trendlines
  3. My favourite chart patterns
  4. Momentum

1.1 Support and resistance

Support and resistance levels can help you identify good entry and exit points. If a market is declining into a solid support zone, the odds are good for a bounce of some sort; or if a market is rallying into overhead resistance, odds for a turn are high. And noting where the support/resistance levels are located can give you added confidence in a trade that you have identified by other methods.
Because support and resistance zones are derived from previous price action, it is clear that markets have memories. Markets remember the price levels where traders have previously established their positions and current price patterns are influenced by them. I will explain how this works in this chapter.
I use four different types of support/resistance levels:
  1. horizontal support/resistance levels in congestion zones
  2. trendlines (sloping lines of support/resistance)
  3. Fibonacci retraces
  4. chart support/resistance
We will now look at these in detail.

1. Horizontal support/resistance levels

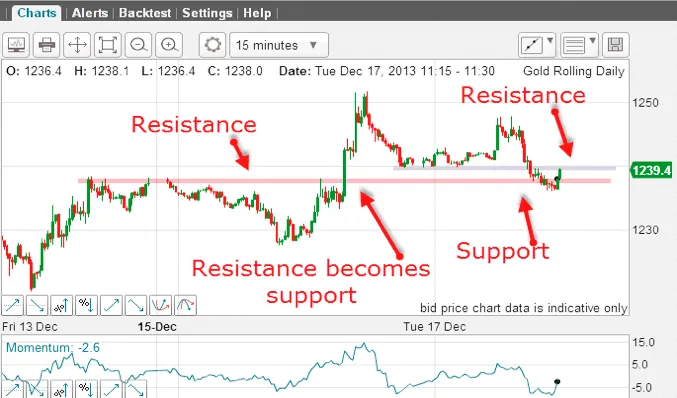
The horizontal support/resistance zone is one of the most basic of charting patterns. One major feature of these levels is that a support line transforms into a line of resistance after the market has penetrated the support (and vice versa). Figure 1.1.1 is a great example of support/resistance areas in gold.
Figure 1.1.1
This is the 15-min gold chart and the resistance level of $1238 is clearly visible with several high touch points between 14 and 16 December. Then, the attempt to break up through the resistance on 16 December was successful with many buy-stop orders being triggered. Many chartists note these resistance levels and place their protective buy stops just above this level. These are the buy-stops of the shorts that are hit when the resistance is overcome. There are also entry buy-stops placed there by those traders looking to be long on such an upward break. After those buy orders were filled the market fell back in a normal re-test and the resistance zone then became a support zone.
On 17 December, the market fell back to test the new support zone. This held and the market proceeded to test the resistance zone. This zone was created by the lows at the $1240 level. When those lows were broken, sell stop-losses were touched. So now, the market is trading between a narrow support and a resistance zone and will break out of it in due course.
So what were the internal dynamics of the market in this period and why does a resistance line turn into a line of support?
I will start with the idea that the current market price is determined by only a small number of traders. It takes only one buyer and one seller to make a price. When you have taken a position either long or short, you have no more influence on the price until you decide to trade again.
So, because short-term players will be trading much more frequently than position traders, these short-term traders determine the short-term price patterns. Many will be trading several times a day. Because these traders are shooting for relatively modest gains per trade, they also limit losses on losing trades.
Let’s take a trader who noted the initial resistance at $1238 and decided to short the market when it reached that level again. With the breaking of this resistance on 16 December, that trade is a loser. When the trader sees the market get away from him as it rallies to $1250, he knows he has a losing trade and will naturally seek to exit his trade if the market gets back to near his entry, thus enabling a smaller loss.
In addition, there will be traders who look to go long on a decline to the $1240 support and this will compound the buying pressure.
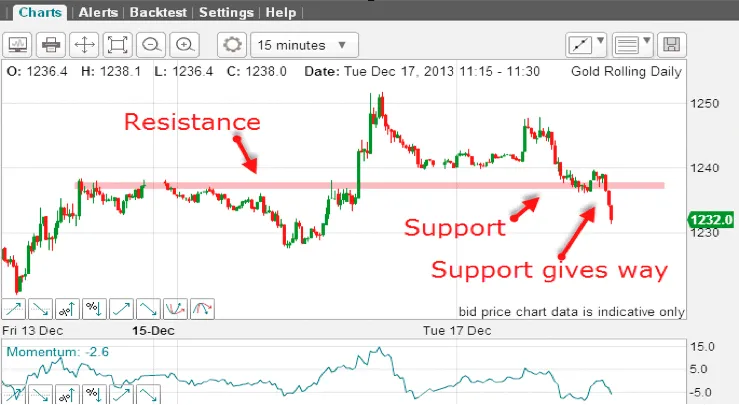
That is why, when the market retreated to the $1240 level, many shorts are covered and new longs initiated, thereby providing buying support. Similarly, when the market broke the $1240 support, it got back to the $1238 area and more buying emerged by the shorts who had a losing trade previously. Figure 1.1.2 shows how that played out.
Figure 1.1.2
The resistance at the $1240 level was strong enough to turn the budding rally back on 17 December. And then the $1238 support level was breached. The market then fell under sustained selling by the disappointed bulls. The bears had won.
A short trade could be made on the break of the support low in the $1236 area because with the break, the previous support line now becomes resistance. Any rallies should be contained by this resistance in the $1238 area. This enables a protective stop to be entered just above this level for a low-risk trade.
I have just described a short-term support and resistance setup with horizontal zones. We can also find horizontal support and resistance zones in longer-term charts.
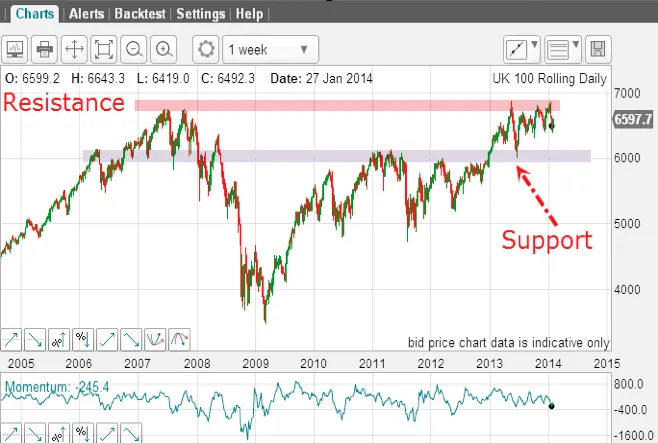
Figure 1.1.3 shows the weekly FTSE 100. The top bar in this chart is a seven-year resistance zone, and the bottom zone is both resistance and support (at various times). The most recent decline in June 2013 was contained by the seven-year support zone, and the most recent highs are being contained by the seven-year resistance zone.
I hope you find this an impressive demonstration that markets have long memories. It is a theme I will keep coming back to. The 6,000 and 6,800 areas are very important for the FTSE 100, which means that if the market gets back to either of these levels, it will be well worth noting for a possible long-term trade setup.
Figure 1.1.3

2. Trendlines (sloping support/resistance)

The trendline is another very basic element of charting. It is the basis of my tramline method, which I cover in detail in Section 2.1.
If we consider a bull market, the price pattern is a series of moves up and down but travelling generally in an upwards direction with higher highs and higher lows.
It is a curious fact that often the lows of these waves can be connected by drawing a straight line between them. Why this phenomenon exists is a m...

Table of contents