A Step-By-Step Introduction to Statistics for Business
eBook - ePub

A Step-By-Step Introduction to Statistics for Business

Richard N. Landers

Share book
  1. 496 pages
  2. English
  3. ePUB (mobile friendly)
  4. Available on iOS & Android
eBook - ePub

A Step-By-Step Introduction to Statistics for Business

Richard N. Landers

Book details
Book preview
Table of contents
Citations

About This Book

A clear and concise introduction to statistics for business and management students, demonstrating how important statistics are in the business decision-making process and covering everything from conducting a survey and collecting data, to summarizing statistical data, and presenting findings.

Each chapter features a real-world business situation and accompanying dataset, the reader is then encouraged to identify the correct statistical concept in the chapter and solve the problem outlined. Offering students a chance to use the newly learned theory in a practical way.

New to the second edition:

  • A "Review of Essential Mathematics" prologue, featuring tests and further links to help students refresh their knowledge of the core mathematical concepts used to calculate basic statistics.
  • Updated screenshots on using IBM SPSS and Excel.
  • A "Statistics in the Real World" feature included at the end of each chapter, demonstrating how statistics are applied in real-world business settings and research, accompanied by reflective questions.
  • Updated case studies, examples and diagrams, illustrating key points and helping to reinforce learning.

The book is accompanied byfree online resources including step-by-step video tutorials on how to use Excel and IBM SPSS, datasets and worked solutions, an Instructors' Manual, Testbank, and PowerPoint presentation slides for lecturers. Essentialreading for business students wanting to know how to use statistics in a business setting.

Frequently asked questions

How do I cancel my subscription?
Simply head over to the account section in settings and click on “Cancel Subscription” - it’s as simple as that. After you cancel, your membership will stay active for the remainder of the time you’ve paid for. Learn more here.
Can/how do I download books?
At the moment all of our mobile-responsive ePub books are available to download via the app. Most of our PDFs are also available to download and we're working on making the final remaining ones downloadable now. Learn more here.
What is the difference between the pricing plans?
Both plans give you full access to the library and all of Perlego’s features. The only differences are the price and subscription period: With the annual plan you’ll save around 30% compared to 12 months on the monthly plan.
What is Perlego?
We are an online textbook subscription service, where you can get access to an entire online library for less than the price of a single book per month. With over 1 million books across 1000+ topics, we’ve got you covered! Learn more here.
Do you support text-to-speech?
Look out for the read-aloud symbol on your next book to see if you can listen to it. The read-aloud tool reads text aloud for you, highlighting the text as it is being read. You can pause it, speed it up and slow it down. Learn more here.
Is A Step-By-Step Introduction to Statistics for Business an online PDF/ePUB?
Yes, you can access A Step-By-Step Introduction to Statistics for Business by Richard N. Landers in PDF and/or ePUB format, as well as other popular books in Business & Ricerca e sviluppo. We have over one million books available in our catalogue for you to explore.

Information

Year
2018
ISBN
9781526417527
Edition
2

Part 1 Descriptive Statistics

Part 1 explores Descriptive Statistics. These are the building blocks of statistics, focusing on how to describe, illustrate and explain data. Each chapter builds on its predecessor, so it is strongly recommended that you read them in the order provided. And if you don’t remember maths, I’d strongly recommend you review the Prologue before getting started.
In Chapter 1, we follow the story of Ben, a small business owner who has hired a consultant to investigate the problem of slowing sales. By reading The Language of Statistics with Ben, you’ll learn how to accurately describe the data his consultant collected and the ways that data are created.
In Chapter 2, we read the story of Jamal, the owner of a small online retail business. He hopes to use website usage data to improve the functioning of his business, but he’s not sure how to interpret the vast piles of data he has acquired. By reading Working with Numbers and Data Display with Jamal, you’ll learn how to describe and summarize data with both tables and graphics.
In Chapter 3, we hear about Sue’s business which conducts taste-testing research for restaurants. While Sue knows how to chart and visualize data from Chapter 2, she wants more accurate summary numbers for her survey data. By reading Central Tendency and Variability with Sue, you’ll learn how to summarize several aspects of numerical datasets with single numbers.
In Chapter 4, we learn about Jill’s used vehicle shop. Jill is worried about the sales performance of her employees and seeks to meaningfully compare their individual figures. By reading Probability Distributions with Jill, you’ll learn how to describe patterns of data and meaningfully compare one dataset with another.
In Chapter 5, we read the story of Alex, general manager of a local branch office of a paper product sales company. Alex wants to meaningfully compare sales at his branch with those across the company but is not sure of the best way to do so. By reading Sampling Distributions with Alex, you’ll learn how data selected from larger collections of data can meaningfully represent those larger collections.

1 The Language of Statistics

What you will learn from this chapter
  • How to describe data in a spreadsheet
  • How to categorize variables by their scale of measurement
  • How to identify whether variables are continuous or discrete, quantitative or qualitative
  • How to identify a Likert-type scale
  • How to specify a population and produce a sample from it
  • How to identify constructs of interest and operationalize them
  • How to identify experiments, quasi-experiments and correlational studies

Data skills you will master from this chapter

  • Creating a dataset
  • Identifying a dataset
  • Navigating a dataset
  • Specifying variable characteristics (SPSS only)

Case Study What Do I Do with This Spreadsheet?

Ben is the owner of Scoops, a local frozen yogurt chain with five locations. Sales have been slumping at some of these locations, and Ben wants to determine the cause. He suspects that some of his store managers have been letting customer satisfaction slip, but he needs a stronger case than a gut feeling to convince them to change their ways. He decides that the first step in getting this evidence will be to assess customer satisfaction at each location and see if it’s affecting sales.
Because Ben doesn’t have a background in statistics, he runs a search on the Internet for a consultancy that can help him answer his questions. He contacts one of the results from his search, Surveys 1-2-3, because they promise to use ‘data-driven techniques to answer any question you have about your business’ for a reasonable fee.
Image 1
After a six-month data collection effort by Surveys 1-2-3, the hired consultant calls Ben to tell him that his data have been collected and his questions answered. He says, ‘Decreased customer satisfaction does not lead to decreased sales at Scoops.’ Ben is surprised, and asks him if he can get more detail or a second opinion. The consultant says, ‘I’ll send you the data so you can see for yourself.’
So now Ben is staring at a spreadsheet full of numbers. There are several rows across several columns of numbers, and he has no idea what any of them mean. He could send the spreadsheet to another consultant, but that’s just going to cost more time and money. And even if he does, what does he do if they disagree? How does he know who to trust – Surveys 1-2-3 or someone else?
inline-image
Take a look at Ben’s spreadsheet of customer satisfaction data for yourself in chapter1.xls (Excel) or chapter1.sav (SPSS) online.
Although for-profit organizations have always focused on the bottom line, there is increasing pressure to collect data from all areas of the organization in order to stay competitive. Simply producing a good product or delivering excellent customer service is often not enough; the owners of a competitive business must constantly conduct research on their own organizations to identify weak points and repair them.
As a result, the case study described above is common in growing small businesses. Suddenly finding themselves needing to conduct such research, many small business owners simply do not have the skills to do so. Like Ben, many recognize this need but do not even fully understand the results of research conducted on their behalf. Learning statistics and research methods are the keys to preventing this from happening to you.
In this chapter, you will take the first step toward understand statistics: learning the language of statistics. This is an especially important chapter because everything else you’ll learn about statistics builds on these concepts. So take your time and make sure you understand them completely before moving on to the next chapter.

1.1 Describing Numbers

In the first half of this chapter, we’ll explore ways to talk about numbers in spreadsheets.
If you find the idea of numbers – with or without spreadsheets – a little intimidating, or if it’s been a while since you took a maths class, now would be a good time to take a look at this book’s Prologue: Review of Essential Mathematics. In that prologue, I refresh you with basic mathematical operations, order of operations, powers and exponents. I also help you start to think with numbers. This is a vital skill as you learn statistics, because it develops your sense of ‘that doesn’t look right’. Developing a ‘that doesn’t look right’ sense helps you avoid making silly mistakes, and silly mistakes with statistics can eventually be very costly for you and your business. So start early by reviewing the Prologue now if you haven’t already!

1.1.1 Datum, Data and Datasets

The general term for a single value collected in the context of research is a datum. A datum might be a number, letter or word. For example, a ‘2’ is a datum, but so is ‘yellow’ or ‘tall’ or even a ‘p’. When you are referring to more than one datum, you are referring to data. You might say, ‘take a look at this datum’ or ‘these data are interesting’.
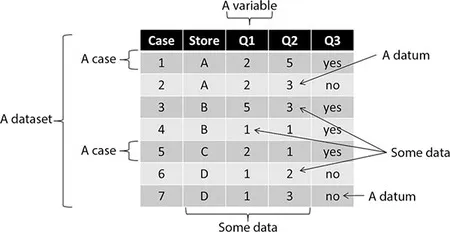
When multiple related data are collected in one place, a dataset is created. In our case study example, the spreadsheet that Ben received was a dataset, as it contained a great deal of data collected for a single purpose. A small piece of that dataset might have looked something like Figure 1.01.
Figure 1.01 Sample dataset with illustration of important chapter terms
Figure 01
This dataset contains many data. In the Q2 column in Figure 1.01, the first ‘3’ is a datum, but if we referred to both that 3 and the 3s below it, we are talking about data.
In fact, you can get a sense of whether or not someone is accustomed to working with real data themselves by whether or not they say ‘data is’ or ‘data are’. People that say ‘data is’, such as ‘the data is incoming’, think about data as a single thing, a resource to be utilized. These people rarely work with actual data, so you should interpret their perspective accordingly. People that actually work with data tend to say ‘data are’, such as ‘the data are complex’, because they think of each number, each letter, or each word of data as a unique piece of information that contributes to a larger complete picture. So that means as a business statistician-in-training, you should say ‘data are’.
Datasets can be further described with two other terms appearing in Figure 1.01: cases and variables. A variable is a collection of data with different values based upon its source, represented in a dataset as a column. For example, if you measured your height and the height of all of your friends, you have measured height as a variable. In Figure 1.01, Store, Q1, Q2 and Q3 are all variables.
If you remember anything from secondary/high school algebra and geometry, you probably remember the value called pi. This value is equal to 3.14159 …, with infinitely more numbers after the decimal. Pi is always this value. It never changes. Any time you see the word ‘pi’ or the symbol π, you know this is what it means. That is what makes pi a constant. If a value is not constant – or in other words, if it varies – it is a variable. When you see the word ‘height’, it could refer to your height, your friend’s height, the height of a building, or any height at all. That means height is a variable. In statistics, constants are generally used in formulas, and variables are usually parts of datasets.
So now that we have all these variables, how do we know which values were collected from the same source? A case is a group of data, collected across one or more variables from one source, represented in a dataset as a complete row. In Figure 1.01, Case 1 contains four data: an ‘A’ for the Store varia...

Table of contents