1.1 Introduction
The study of geographic phenomena often requires the application of statistical methods to produce new insight. The following questions serve to illustrate the broad variety of areas in which statistical analysis has been applied to geographic problems:
- How do blood lead levels in children vary over space? Are the levels randomly scattered throughout the city, or are there discernible geographic patterns? How are any patterns related to the characteristics of both housing and occupants? (Griffith et al., 1998).
- Can the geographic diffusion of democracy that has occurred during the post-World War II era be described as a steady process over time; has it occurred in waves, or have there been ‘bursts’ of diffusion that have taken place during short time periods? (O’Loughlin et al., 1998).
- What are the effects of global warming on the geographic distribution of species? For example, how will the type and spatial distribution of tree species change in particular areas? (MacDonald et al., 1998).
- What are the effects of different marketing strategies on product performance? For example, are mass-marketing strategies effective, despite the more distant location of their markets? (Cornish, 1997).
These studies all make use of statistical analysis to arrive at their conclusions. Methods of statistical analysis play a central role in the study of geographic problems – in a survey of articles that had a geographic focus, Slocum (1990) found that 53% made use of at least one mainstream quantitative method. The role of statistical analysis in geography may be placed within a broader context through its connection to the ‘scientific method’, which provides a more general framework for the study of geographic problems.
1.2 The Scientific Method
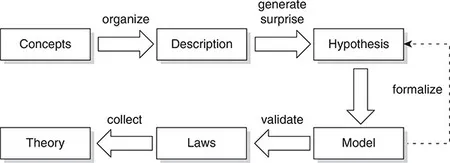
Social scientists as well as physical scientists often make use of the scientific method in their attempts to learn about the world. Figure 1.1 illustrates this method, from the initial attempts to organize ideas about a subject, to the building of a theory.
Figure 1.1 The scientific method
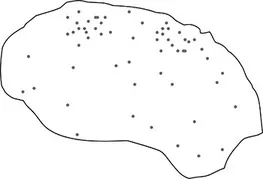
Suppose that we are interested in describing and explaining the spatial pattern of cancer cases in a metropolitan area. We might begin by plotting recent incidences on a map. Such descriptive exercises often lead to an unexpected result – in Figure 1.2, we perceive two fairly distinct clusters of cases. The surprising results generated through the process of description naturally lead us to the next step on the route to explanation by forcing us to generate hypotheses about the underlying process. A rigorous definition of the term hypothesis is a proposition whose truth or falsity is capable of being tested. We can also think of hypotheses as potential answers to our initial surprise. For example, one hypothesis in the present example might be that the pattern of cancer cases is related to the distance from local power plants.
Figure 1.2 Distribution of cancer cases
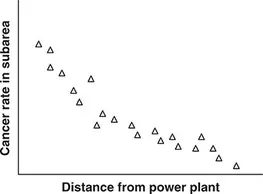
To test the hypothesis, we need a model, which is a device for simplifying reality so that the relationship between variables may be more clearly studied. Whereas a hypothesis might suggest a relationship between two variables, a model is more detailed, in the sense that it suggests the nature of the relationship between the variables. In our example, we might speculate that the likelihood of cancer declines as the distance from a particular power plant increases. To test this model, we could plot cancer rates for subareas versus the distance from the subarea centroids to the power plant. If we observe a downward sloping curve, we have gathered some support for our hypothesis (see Figure 1.3).
Figure 1.3 Cancer rates versus distance from power plant
Models are validated by comparing observed data with what is expected. If the model is a good representation of reality, there will be a close match between the two. If observations and expectations are far apart, we need to ‘go back to the drawing board’, and come up with a new hypothesis. It might be the case, for example, that the pattern in Figure 1.2 does not seem to be related to the distance to power plants. In that case we would want to search for other possible explanations.
Though models are often used to learn about particular situations, more often one also wishes to learn about the underlying process that led to it. We would like to be able to generalize from one study to statements about other situations. One reason for studying the spatial pattern of cancer cases is to determine whether there is a relationship between cancer rates and the distance to specific power plants; a more general objective is to learn about the relationship between cancer rates and the distance to any power plant. One way of making such generalizations is to accumulate a lot of evidence. If we were to repeat our analysis in many locations throughout a country, and if our findings were similar in all cases, we would have uncovered an empirical generalization. In a strict sense, laws are sometimes defined as universal statements of unrestricted range – that is, the statement may be applied to any place, during any time period. In our example, we might not expect our generalization to have an unrestricted range, and we might want, for example, to confine our generalization or empirical law to power plants and cancer cases in the country of interest.
Einstein called theories ‘free creations of the human mind’. In the context of our diagram, we may think of theories as collections of generalizations or laws. The collection is greater than the sum of its parts in the sense that it provides greater insight than that produced by the individual generalizations or laws alone. If, for example, we generate other empirical laws that relate cancer rates to other factors, such as diet, we begin to build a theory of the spatial variation in cancer rates.
Statistical methods occupy a central role in the scientific method, as portrayed in Figure 1.1, because they allow us to suggest and test hypotheses using models. In the following section, we will review some of the important types of statistical approaches in geography.
1.3 Exploratory and Confirmatory Approaches in Geography
The scientific method provides us with a structured approach to answering questions of interest. At the core of the method is the desire to form and test hypotheses. As we have seen, hypotheses may be thought of loosely as potential answers to questions. For instance, a map of snowfall may suggest the hypothesis that the distance away from a nearby lake may play an important role in the distribution of snowfall amounts.
Geographers use spatial analysis within the context of the scientific method in at least two distinct ways. Exploratory methods of analysis are used to suggest hypotheses; confirmatory methods are, as the name suggests, used to help confirm hypotheses. A method of visualization or description that led to the discovery of clusters in Figure 1.2 would be an exploratory method, while a statistical method that confirmed that such an arrangement of points would have been unlikely to occur by chance would be a confirmatory method. In this book, we will focus primarily on confirmatory methods.
We should note two important points here. First, confirmatory methods do not always confirm or refute hypotheses – the world is too complicated a place, and the methods often have important limitations that prevent such absolute confirmation and refutation. Nevertheless, they are important in structuring our thinking and in taking a rigorous and scientific approach to answering questions. Second, the use of exploratory methods over the past decade has been increasing rapidly. This has come about as a result of a combination of the availability of large databases and sophisticated software (including GIS), and a recognition that confirmatory statistical methods are appropriate in some situations and not others. Throughout the book, we will keep the reader aware of these points by noting some of the limitations of confirmatory analysis.
1.4 Probability and Statistics
1.4.1 Probability
Probability may be thought of as a measure of uncertainty, with the measure taking on a value ranging from zero to one. Experiments and processes often have many possible outcomes, and the specific outcome is uncertain until it is observed. If we happen to know that a particular outcome will definitely not occur, that outcome has a probability of zero. At the other extreme, if we know that an outcome will occur, it is said to have a probability of one. At these two extremes, there is no uncertainty regarding whether the outcome will occur. When we are maximally uncertain about the outcome of an event, its probability is equal to 0.5 (i.e., 1/2); there is a ‘50–50’ chance that it will occur. A major focus of the study of probability is the study of the likelihood of various outcomes. How likely or probable is it that a town will be struck by two hurricanes in one season? What is the probability that a resident in a community who is 4 km from a new grocery store will become a new customer?
Probabilities may be derived in a variety of ways, ranging from subjective beliefs to the use of relative frequencies of past events. When guessing whether a coin will come up heads when tossed, you may choose to believe that the coin is ‘fair’ and consequently that the probability of heads (and tails) is equal to 0.5, or you could estimate the probability of heads by actually tossing the coin many times to determine the proportion of times that the result is heads. If you tossed it 1000 times, and it came up heads 623 times, an estimate of the probability of heads that relied on relative frequency would be 623/1000 = 0.623.
The study of probability has its origins, at least to some degree, in questions of gambling that arose in the 17th century. In particular, correspondence between Pascal and Fermat in 1654 (Tannery and Henry 1894) concerned how to properly resolve a game of chance proposed by deMéré that had to be terminated before its conclusion. Suppose that the first player with three wins is declared the overall winner, and can lay claim to the prize of 64 pistoles (pistole is the French word given at the time to a Spanish gold coin). How should the prize money be divided, given that the game had to be terminated, and given that one player had two wins, and the other had one win? DeMéré argued that the player with two wins player should receive 2/3 of the prize, because that person had two-thirds of the wins. Since 2/3 of 64 is 42.67, the other player would receive the remaining 21.33 pistoles.
Fermat wrote to Pascal with an alternative solution. Pascal agreed with it, and in a letter to Fermat suggested a more complete and compact way of stating that solution. In particular, he argued that the two players should consider what could happen if they continued. With probability equal to ½, the player with only one win would win the next round, and they could then split the pot of money (each receiving 32 pistoles), since they w...