![]()
1Beef consumption: historical overview, recent trends and contemporary attitudes
B.J. Santich
CONTEMPORARY BEEF CONSUMPTION
In 2012 beef consumption varied widely across the globe, from slightly more than 1 kg per capita annually in Bangladesh to 54 kg per person annually in Argentina and Uruguay (USDA 2011). Consumption levels are typically dependent on there being a tradition of beef production, which may be associated with religious beliefs, and household income. In Australia and the USA, all three factors play significant roles, but in other countries, one factor may predominate. For example, in 2011, per capita consumption of beef and veal in Hong Kong was only slightly less than in Australia even though Hong Kong produces very little beef and is almost totally dependent on imports of beef and live cattle. However, Hong Kong is among the top 20 countries in terms of gross national income per capita (World Bank 2013).
According to the US Department of Agriculture (USDA 2011), the top 10 beef-consuming countries in October 2011 were Argentina, Uruguay, Brazil, the USA, Paraguay, Australia, Hong Kong, Canada, New Zealand and Kazakhstan. In these countries, per capita consumption was more than 26 kg per annum. In the six highest-ranking countries, per capita consumption exceeded 34 kg per annum (Table 1.1). Although the order may change from year to year, the same countries have tended to occupy the top six rankings for the past two decades. All are major beef-producing countries or wealthy countries with a high standard of living.
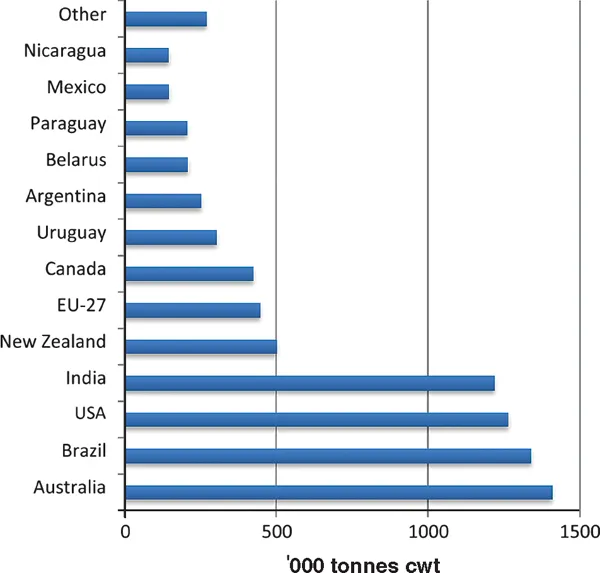
The principal beef-producing countries – Argentina, Australia, Brazil, Canada and the USA (Chapters 5 and 6), but excluding China – together accounted for 43% of world beef production in 2011 (FAOSTAT 2013; Fig. 1.2) and are all significant beef consumers, with beef representing at least one-third of total per capita meat and poultry consumption. However, cattle are not indigenous to any of these countries; beef production and consumption are imported traditions. In the case of Australia, Canada and the USA, these traditions originated in England, where beef has been a popular and valued meat for many centuries. From at least the 16th century, beef was the most prestigious meat in England and it was the most common meat in the British diet until the mid 1960s (Rogers 2003; National Food Survey 2011).
Table 1.1: Beef and veal consumption 2011, selected countries
| Country | kg per capita per year |
| Argentina | 54.0 |
| Uruguay | 53.9 |
| Brazil | 37.6 |
| USA | 37.4 |
| Paraguay | 37.0 |
| Australia | 34.2 |
| Hong Kong | 32.3 |
| Canada | 29.2 |
| New Zealand | 28.0 |
| Kazakhstan | 26.5 |
| Chile | 25.9 |
| Uzbekistan | 21.7 |
| Colombia | 19.0 |
| Venezuela | 18.8 |
| Mexico | 17.8 |
Source: USDA Foreign Agricultural Service (2011).
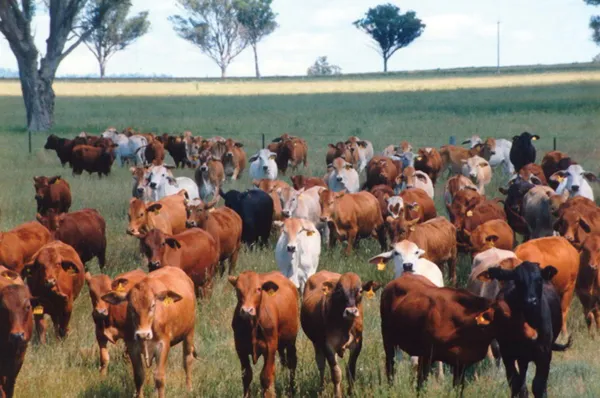
Figure 1.1: Cattle being grazed on pasture. Source: Cattle Council of Australia.
In the past few decades, consumption has tended to decrease in traditional beef-producing and beef-consuming countries such as Australia and the USA in concert with a general decrease in red meat consumption and an increase in poultry consumption (Table 1.2). In contrast, red meat consumption has increased in countries that do not have a long history of beef consumption, mainly because of increased affluence, greater affordability of beef and Westernisation of diets and eating habits. In Taiwan, for example, average per capita consumption doubled between 1992 and 2011, albeit to only 6.0 kg per year (FAOSTAT 2011).
Figure 1.2: Major beef-exporting countries, 2011. Source: Meat and Livestock Australia (2011).
MEAT CONSUMPTION TRENDS IN THE 20TH CENTURY
Beef consumption is generally associated with developed countries and with high levels of total meat and poultry consumption (Table 1.2).
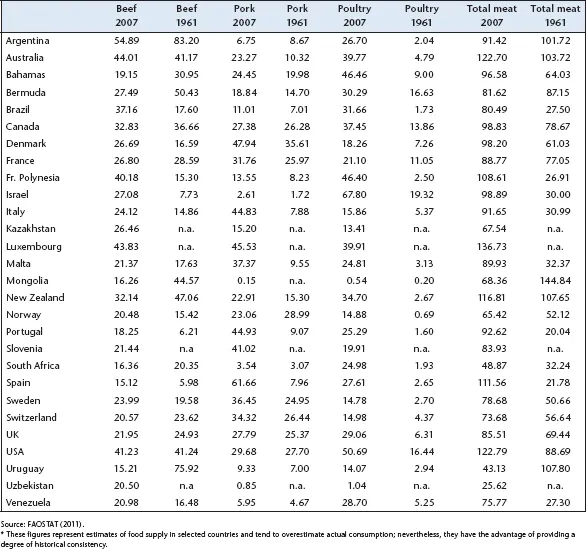
Although there was no consistent global trend in respect of beef between 1961 and 2007, poultry supply in all countries listed in Table 1.2 was significantly greater in 2007 than in 1961. In almost all countries, poultry’s share of total meat supply increased between 1961 and 2007; in Israel, poultry accounted for 69% of the total meat supply of 99 kg per person in 2007.
FAO data are a useful guide to relative levels of consumption in various countries, but it is important to acknowledge the inaccuracy of consumption estimates because they are based on data on production, exports, imports and changes in stocks. Consumption statistics based on weekly purchases for a large sample of households, such as those compiled by the British National Food Survey, provide a closer approximation of consumption, but even these include a margin for error (Prynne et al. 2009). Recent research shows that the latter method may overestimate actual meat consumption by 43% because purchases may include bone and other non-edible components and because proportions of meat vary between composite meat-containing dishes (Prynne et al. 2009). The estimates quoted in the following paragraphs are all associated with varying margins of error in relation to actual consumption.
Table 1.2: Meat supply: selected countries (kg per person per year)*
Although beef consumption estimates vary widely from country to country, Australia, Britain and the USA experienced similar trends over the course of the 20th century, and similar factors were responsible for these changes. In these countries, beef consumption peaked and then decreased as chicken and pork assumed an increasing share of total meat and poultry consumption. In Brazil, on the other hand, strong economic growth in recent years increased beef consumption (per capita supply) more than two-fold between 1961 and 2007.
At the end of the 19th century, Australians had the enviable reputation of being the greatest consumers of meat in the world; at this time, ‘meat’ was construed as beef and mutton. Citing New South Wales government statistician T.A. Coghlan, Dr Philip Muskett reported that annual per capita meat consumption ranged from 275 lb (125 kg) in Victoria and 291 lb (132 kg) in New South Wales to 371 lb (169 kg) in Queensland. In comparison, the British consumed 109 lb (49.5 kg) of meat per year, Americans consumed 150 lb (68 kg) of meat per year and Europeans consumed less than 70 lb (32 kg) of meat per year (Muskett 1893). Meat consumption in New South Wales decreased from 124 kg in 1912 to 79 kg in 1919/20, but subsequently increased until the eve of World War II (Santich 1995).
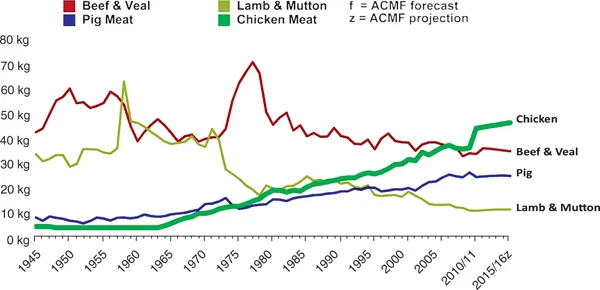
The first official national estimates of apparent meat consumption in Australia date from the mid 1930s. Over the three years ending 1938/39, average annual per capita meat consumption (no estimates were available for poultry consumption) was 107 kg (carcass weight equivalent), beef accounting for 59% (64 kg) of the total (ABS 2000). Historically, Australians consume more beef and veal than mutton and lamb, but in the late 1960s both were equally popular. After a slight decrease in the 1940s, beef consumption increased again to a peak of 70 kg in 1977, but then decreased to 36 kg in 2009/10 (ABARE 2009). Significantly, chicken overtook beef as the nation’s most popular meat in 2005 (Fig. 1.3).
In the USA, beef consumption also peaked in the 1970s, reaching 58 kg per person plus 1.8 kg veal (carcass weight) in 1976. For much of the first half of the 20th century, Americans ate more pork than beef, but from the early 1950s, as hamburger chains spread across the country, beef became the dominant meat. Between 1951/55 and 1961/65, average annual per capita consumption increased by 29%, and much of the beef consumed was in the form of hamburgers. In the early 1980s, Americans ate nearly 23 kg of ground beef annually, mostly in the form of hamburgers (Harris 1987). Poultry consumption began to increase during this period and by the mid 1990s had overtaken beef and veal consumption. The decrease in beef and veal consumption after 1976 was gradual and in 2009 Americans consumed 40 kg of beef and veal per person. This is roughly the same as the amount consumed in the early 1960s, and slightly less than half of the beef and veal consumed was in the form of ground beef. According to Schlosser (2001), American adults ate three hamburgers per week in the 1990s. In 2009, beef constituted only 33% of total meat and poultry consumption, compared with nearly 50% at the beginning of the 20th century and 54% in 1976 (USDA Economic Research Service 2011).
British beef consumption trends are generally consistent with those in Australia and the USA, although the base point is considerably lower in the UK. A series of surveys, mainly of working-class families, at the end of the 19th century indicated that total meat consumption in England ranged from 21 kg per person per year for the poorest households to 76 kg for households that could afford to employ servants (Oddy 1970). Annual meat consumption increased until 1939, but decreased after the introduction of rationing in 1940 to a nadir of 34 kg in 1949. In 1952, annual beef consumption was only 8.8 kg per person. Although meat rationing remained in force until 1954, consumption increased during the 1950s, beef consumption reaching 16 kg (30% of total meat consumption) in 1957. Twenty years later, beef’s share of total annual meat and poultry consumption in Britain had fallen to 20% and in 2000, at 6.5 kg, constituted only 13%. Pork consumption remained at a high level after rationing ceased, exceeded that of beef and poultry by the mid 1960s and constituted 26% of total meat and poultry consumption in 2000 (National Food Survey 2011). Data from the 2008/2009 National Diet and Nutrition Survey, which relied on a methodology that differed from that used in the National Food Survey, suggest that consumption of red and white meat across all age groups and sexes has increased during the 21st century (Wyness et al. 2011). Corroborating this trend, data from the Family Food Survey indicate that purchases of beef and veal increased between 2008 and 2009 (Wyness et al. 2011).
Figure 1.3: Consumption of various meats in Australia. Source: Australian Chicken Meat Federation (2012).
Of the countries that comprise the European Union, France, which is also a significant beef producer, had the highest per capita beef consumption (25 kg carcass equivalent) in 2009, but this value is much lower than that for Australia or the USA. Overall, French per capita meat consumption rose steadily from 1970 but decreased by 7% from 1998 to 2009. Much of this decrease was accounted for by a decrease in beef consumption, which constituted only 29% of total meat consumption in 2009 compared with 39% in 1970. In contrast, pork held its share of ∼39% of total meat consumption and that of poultry increased from 16% to 28% of total meat consumption (FranceAgriMer 2010).
Similar factors were responsible for decreases in beef consumption in various countries. In the 1970s, health authorities often advised people to eat less red meat because of its association with high circulating levels of saturated fatty acids and cholesterol, both of which are associated with coronary heart disease. In Australia, for example, the National Heart Foundation encouraged consumers to switch to white meats such as chicken, veal and fish. Polyunsaturated Cookery, published by the National Heart Foundation in 1974, included 27 recipes for chicken and veal and eight for fish, but only 15 recipes for beef and 18 for lamb (Santich 1995). In subsequent decades, the ideal healthy diet was based on the inclusion of unrefined or minimally processed carbohydrates to lower fat intake. Whether intentionally or not, this concept also had the effect of reducing the quantities of meat in the diet. In 1998, the Australian Guide to Healthy Eating recommended that adults eat red meat three to four times per week, a serving size being 65–100 g of cooked meat which would amount to an annual consumption of 10–21 kg per capita. This represents a significant change from the eating habits of the 1950s and 1960s, when red meat would typically be eaten every day of the week and in larger amounts (Children’s Health Development Foundation 1998).
These health-motivated changes occurred at a time when the availability of chicken was increasing. Since the introduction of intensive poultry farming practices in the mid 1960s, Australian production has increased more than 10-fold ...