- 410 pages
- English
- ePUB (mobile friendly)
- Available on iOS & Android
eBook - ePub
Graphical Methods for Data Analysis
About this book
This book present graphical methods for analysing data. Some methods are new and some are old, some require a computer and others only paper and pencil; but they are all powerful data analysis tools. In many situations, a set of data ? even a large set- can be adequately analysed through graphical methods alone. In most other situations, a few well-chosen graphical displays can significantly enhance numerical statistical analyses.
Trusted by 375,005 students
Access to over 1.5 million titles for a fair monthly price.
Study more efficiently using our study tools.
Information
1
Introduction
1.1 Why Graphics?
There is no single statistical tool that is as powerful as a well-chosen graph. Our eye-brain system is the most sophisticated information processor ever developed, and through graphical displays we can put this system to good use to obtain deep insight into the structure of data. An enormous amount of quantitative information can be conveyed by graphs; our eye-brain system can summarize vast information quickly and extract salient features, but it is also capable of focusing on detail. Even for small sets of data, there are many patterns and relationships that are considerably easier to discern in graphical displays than by any other data analytic method. For example, the curvature in the pattern formed by the set of points in Figure 1.1 is readily appreciated in the plot, as are the two unusual points, but it is not nearly as easy to make such a judgment from an equivalent table of the data. (This figure is more fully discussed in Chapters 5.)
The graphical methods in this book enable the data analyst to explore data thoroughly, to look for patterns and relationships, to confirm or disprove the expected, and to discover new phenomena. The methods also can be used to enhance classical numerical statistical analyses. Most classical procedures are based, either implicitly or explicitly, on assumptions about the data, and the validity of the analyses depends upon the validity of the assumptions. Graphical methods provide powerful diagnostic tools for confirming assumptions, or, when the assumptions are not met, for suggesting corrective actions. Without such tools, confirmation of assumptions can be replaced only by hope.
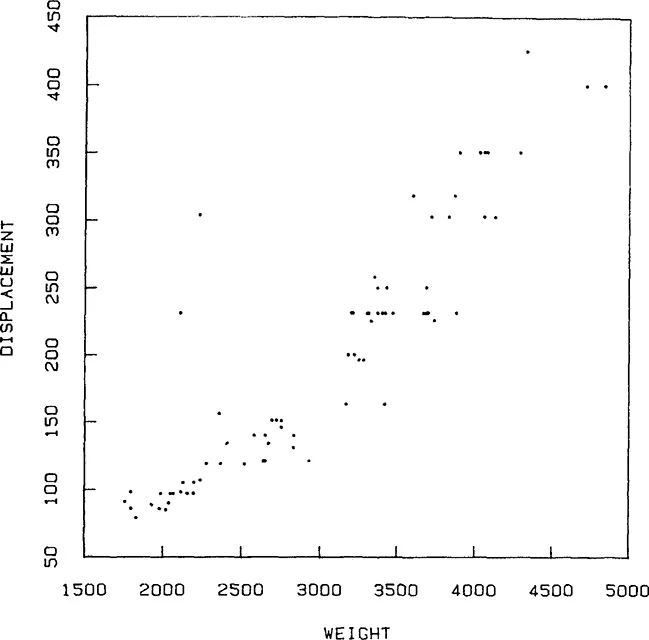
Figure 1.1 Scatter plot of displacement (in cubic inches) versus weight (in pounds) of 74 automobile models.
Until the mid-1970’s, routine large-scale use of plots in data analysis was not feasible, since the hardware and software for computer graphics were not readily available to many people and making large numbers of plots by hand took too much time. We no longer have such an excuse. The field of computer graphics has matured. The recent rapid proliferation of graphics hardware — terminals, scopes, pen plotters, microfilm, color copiers, personal computers — has been accompanied by a steady development of software for graphical data analysis. Computer graphics facilities are now widely available at a reasonable cost, and this book has a relevance today that it would not have had prior to, say, 1970.
1.2 What Is A Graphical Method For Analyzing Data?
The graphical displays in this book are visual portrayals of quantitative information. Most fall into one of two categories, displaying either the data themselves or quantities derived from the data. Usually, the first type of display is used when we are exploring the data and are not fitting models, and the second is used to enhance numerical statistical analyses that are based on assumptions about relationships in the data. For example, suppose the data are the heights xi and weights yi of a group of people. If we knew nothing about height and weight, we could still explore the association between them by plotting yi against xi; but if we have assumed the relationship to be linear and have fitted a linear function to the data using classical least squares, we will want to make a number of plots of derived quantities such as residuals from the fit to check the validity of the assumptions, including the assumptions implied by least squares.
If you have not already done so, you might want to stop reading for a moment, leaf through the book, and look at some of the figures. Many of them should look very familiar since they are standard Cartesian plots of points or curves. Figures 1.2 and 1.3, which reappear later in Chapters 3 and 7, are good examples. In these cases the main focus is not on the details of the vehicle, the Cartesian plot, but on what we choose to plot; although Figures 1.2 and 1.3 are superficially similar to each other, each being a simple plot of several dozen discrete points, they have very different meanings as data displays. While these displays are visually familiar, there are other displays that will probably seem unfamiliar. For example, Figure 1.4, which comes from Chapters 5, looks like a forest of misshapen trees. For such displays we discuss not only what to plot, but some of the steps involved in constructing the plot.
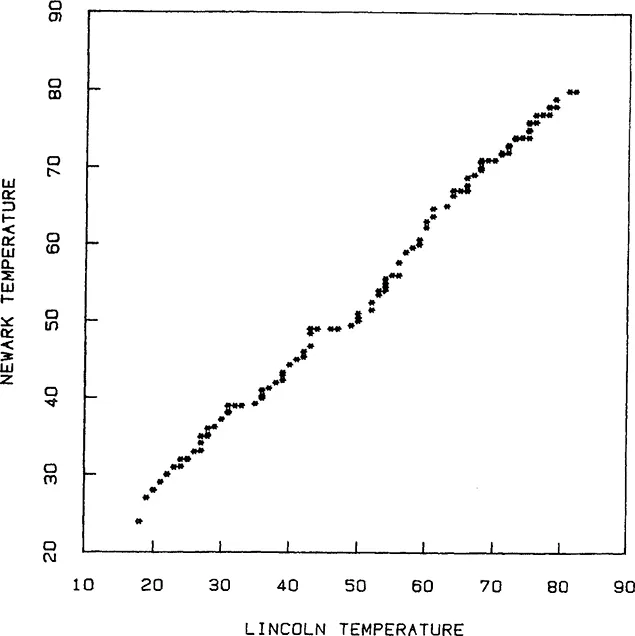
Figure 1.2 Empirical quantile-quantile plot of Newark and Lincoln monthly temperatures.
1.3 A Summary Of The Contents
The book is organized according to the type of data to be analyzed and the complexity of the data analysis task. We progress from simple to complex situations. Chapters 2, 3, 4 and 5 contain mostly exploratory methods in which the raw data themselves are displayed. Chapters 2 describes methods for portraying the distribution of a single set of observations, for showing how the data spread out along the observation scale. Methods for comparing the distributions of several data sets are covered in Chapters 3. Chapters 4 deals with paired measurements, or two-dimensional data; the graphical methods there help us probe the relationship and association between the two variables. Chapters 5 does the same for measurements of more than two variables; an example of such multidimensional data is the heights, weights, blood pressures, pulse rates, and blood types of a group of people.
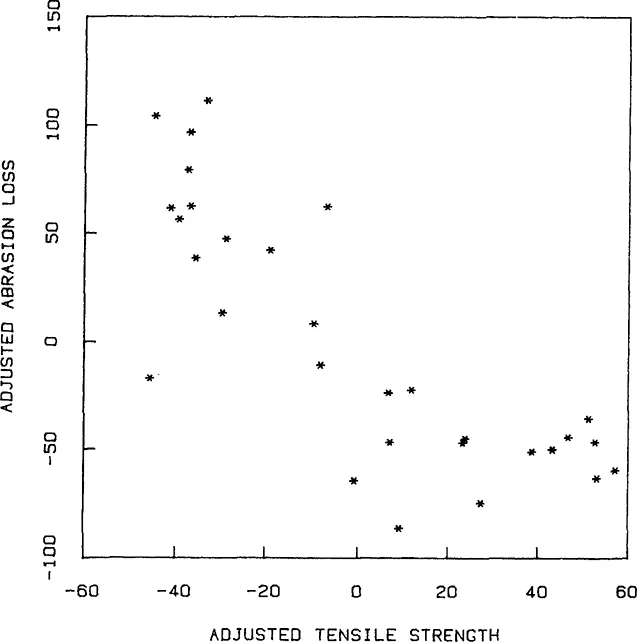
Figure 1.3 Adjusted variable plot of abrasion loss versus tensile strength, both variables adjusted for hardness.
Chapters 6 and 7 present methods for studying data in the context of statistical models and for plotting quantities derived from the data. Here the displays are used to enhance standard numerical statistical analyses frequently carried out on data. The plots allow the investigator to probe the results of analyses and judge whether the data support the underlying assumptions. Chapters 6 is about probability plots, which are designed for assessing formal distributional assumptions for the data. Chapters 7 covers graphical methods for regression, including methods for understanding the fit of the regression equation and methods for assessing the appropriateness of the regression model.
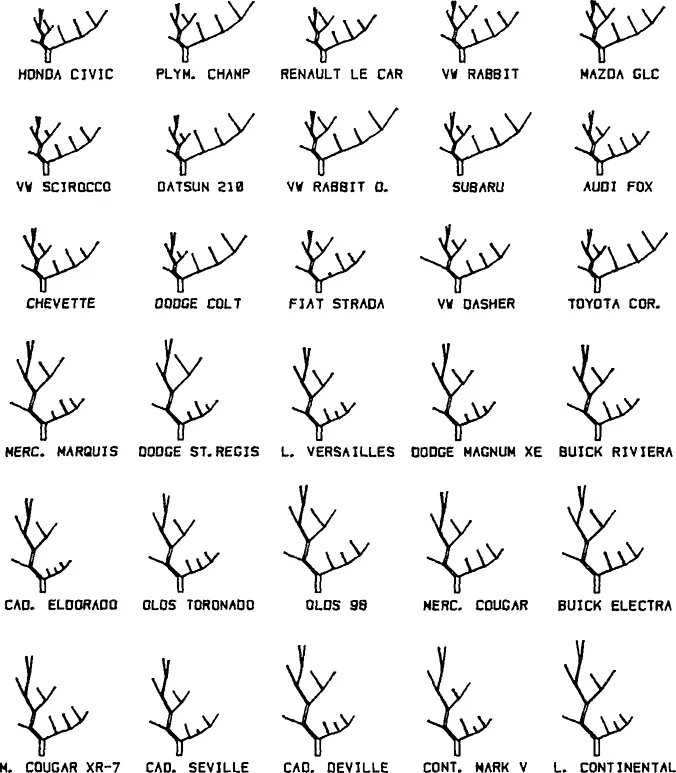
Figure 1.4 Kleiner-Hartigan trees.
Chapters 8 is a general discussion of graphics including a number of principles that help us judge the strengths and weaknesses of graphical displays, and guide us in designing new ones.
The Appendix contains most of the data sets used in the examples of the book and other data sets referred to just in the exercises.
1.4 The Selection And Presentation Of Materials
We have selected a group of graphical methods to treat in detail. Our plan has been first to give all the information needed to construct a plot, then to illustrate the display by applying it to at least one set of data, and finally to describe the usefulness of the method and the role it plays in data analysis.
The process for selecting methods to feature was a parochial one: we chose methods that we use in our own work and that have proved successful. Such a selection process is necessary, for we cannot write intelligently about methods that we have not used. We have had to exclude many promising ones with which we are just beginning to have some experience and others that we are simply unfamiliar with. Some of these are briefly described and referenced in “Further Reading” sections at the ends of chapters.
1.5 Data Sets
Almost all of the data sets used in this book to illustrate the methods are in the Appendix together with other data sets that are treated in the exercises. There are two reasons for this. One is to provide data for the reader to experiment with the graphical methods we describe. The second is to allow the reader to challenge more readily our methodology and devise still better graphical methods for data analysis. Naturally, we encourage readers to collect other data sets of suitable nature to experiment further.
1.6 Quality Of Graphical Displays
The plots shown in this book are generally in the form we would produce in the course of analyzing data. Most of them represent what you could expect to produce, routinely, from a good graphics package and a reasonably inexpensive graphics device, such as a pen plotter. A few plots have been done by hand. None were produced on special, expensive graphics devices. The point is that the value of graphs in data analysis comes when they show important patterns in the data, and plain, legible, well-designed plots can do this without the expense and delay involved with special presentation-quality graphics devices.
Naturally, when the plots are to be used for presentation or publication rather than for analysis, making the graphics elegant and aesthetically pleasing would be important. We have deliberately not made such changes here. These are working plots, part of the everyday business of data analysis.
1.7 How Should This Book Be Used?
Readers who experiment with the graphical methods in this book by trying them in the exercises, on the data in the Appendix, and on their own data will learn far more from this book than passive readers.
It is usually easy to understand the details of making a particular plot. What is more difficult is to acquire the judgment necessary for successful application of the method: When should the method be used? For what types of data? For what types of problems? What patterns should be looked for? Which patterns are significant and which are spurious? What has been learned about the data in its a...
Table of contents
- Cover
- Half Title
- Title Page
- Copyright Page
- Dedication
- Preface
- Contents
- 1 Introduction
- 2 Portraying the Distribution of a Set of Data
- 3 Comparing Data Distributions
- 4 Studying Two-Dimensional Data
- 5 Plotting Multivariate Data
- 6 Assessing Distributional Assumptions About Data
- 7 Developing and Assessing Regression Models
- 8 General Principles and Techniques
- Reference
- Appendix: Tables of Data Sets
- Index
Frequently asked questions
Yes, you can cancel anytime from the Subscription tab in your account settings on the Perlego website. Your subscription will stay active until the end of your current billing period. Learn how to cancel your subscription
No, books cannot be downloaded as external files, such as PDFs, for use outside of Perlego. However, you can download books within the Perlego app for offline reading on mobile or tablet. Learn how to download books offline
Perlego offers two plans: Essential and Complete
- Essential is ideal for learners and professionals who enjoy exploring a wide range of subjects. Access the Essential Library with 800,000+ trusted titles and best-sellers across business, personal growth, and the humanities. Includes unlimited reading time and Standard Read Aloud voice.
- Complete: Perfect for advanced learners and researchers needing full, unrestricted access. Unlock 1.5M+ books across hundreds of subjects, including academic and specialized titles. The Complete Plan also includes advanced features like Premium Read Aloud and Research Assistant.
We are an online textbook subscription service, where you can get access to an entire online library for less than the price of a single book per month. With over 1.5 million books across 990+ topics, we’ve got you covered! Learn about our mission
Look out for the read-aloud symbol on your next book to see if you can listen to it. The read-aloud tool reads text aloud for you, highlighting the text as it is being read. You can pause it, speed it up and slow it down. Learn more about Read Aloud
Yes! You can use the Perlego app on both iOS and Android devices to read anytime, anywhere — even offline. Perfect for commutes or when you’re on the go.
Please note we cannot support devices running on iOS 13 and Android 7 or earlier. Learn more about using the app
Please note we cannot support devices running on iOS 13 and Android 7 or earlier. Learn more about using the app
Yes, you can access Graphical Methods for Data Analysis by J. M. Chambers in PDF and/or ePUB format, as well as other popular books in Mathematics & Probability & Statistics. We have over 1.5 million books available in our catalogue for you to explore.