![]()
1 Environmental policy and climate change
Two decades of change, consensus and conflict
Over recent times there has developed an understandable view of the United States of America as a country with only a limited commitment to the fight against climate change and with limited engagement with the broader sustainability agenda. Indeed as Reich argues, ‘As a nation the United States seems incapable of doing what is required to reduce climate change’ (Reich 2008: 5). The failure of the US Congress to ratify the 1997 Kyoto Protocol on the reduction of greenhouse gases and the record of the George W. Bush Presidency certainly seems to back up such a perception. However, this chapter will argue that the actual picture is far more nuanced and complex.
The last two decades have seen an ever-growing partisan divide with the US political system. The debate between the two main political parties, the Democrats and Republicans, has become ever more rancorous and toxic. This intensified with the election of Barack Obama back in 2008. All too often policy debates about the environment and tackling climate change in the US have been drowned out by the white noise of an increasingly partisan and hysterical political culture. Add in the constitutional exigency of the ‘separation of powers’ and the result has been policy gridlock across a range of issues. Action on tackling climate change has not been immune from this. Leading politicians, specifically conservative Republicans and Tea Party supporters, ‘pour scorn on the very existence of a climate change problem, ignore or subvert the science, and argue that the whole thing is a put up job designed to increase big government and undermine American values’ (Atkinson 2015: 89).
Yet it was not always like this. In the period from 1964 to 1980, during what has been described as the ‘golden age’ of US environmental policy, a wide range of legislation was passed and policies enacted. These included support for the eco system, the protection of wildlife, and measures to protect water and air quality. There was a broad consensus across the political spectrum on the desirability of such policies. Nothing better illustrates this consensus than the creation of the US EPA. It was supported by a Democratic dominated Congress and signed into law by Republican President Richard Nixon.
The chapter is divided into three sections. First, the policy challenge of climate change is set in its broader context. Second, there will be an analysis of the ‘golden age’ of environmental policy. Third, there is a broad survey of the politics of climate change in the US over the last two decades. This chapter will set the scene and provide the context for a more detailed analysis of the politics of climate change in the US in subsequent chapters.
The challenge of climate change: evidence and debate
We are now living in what has been described as the anthropocene era. This is an argument that the impact of human behaviour on planet earth over a sustained period of time has been so significant as to constitute a new geological epoch. This is no more evident than in the challenge of climate change. As Bierman has cogently argued, ‘Humans now influence all biological and physical systems of the planet. Almost no species, land area, or part of the oceans has remained unaffected by the expansion of the human species’ (Bierman 2014: viii).
There is now an overwhelming consensus in the global scientific community that climate change is real and that it is the result of human action in the shape of the extensive use of fossils fuels such as oil, coal and gas since the start of the Industrial Revolution. This has resulted in the release of large amounts of carbon dioxide gas into the earth’s atmosphere. Carbon dioxide acts as a ‘greenhouse’ gas, trapping additional heat from the sun in the earth’s atmosphere. This is referred to as the ‘greenhouse effect’. As a consequence, the earth’s temperature is rising steadily but inexorably with potentially grave and unpredictable consequences for both planet and people. Tackling climate change has taken on increased saliency over the last few years, but has been evident in policy circles for 30 years or more.
For example, on 23 June 1988 the American scientist James Hansen presented evidence to the US Senate. He told the assembled senators that he was 99 per cent certain that the record temperatures that year in the US were not the result of natural variations but were the consequence of growing concentrations of greenhouse gases in the earth’s atmosphere. ‘It is time to stop waffling so much,’ argued Hansen, ‘and say that the evidence is pretty strong that the greenhouse effect is here’ (Worldwatch Institute 2009: 6). In the 28 years since Hansen gave his testimony that evidence has grown stronger.
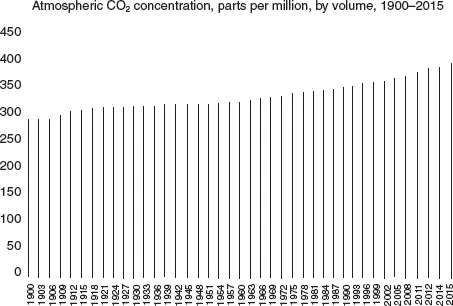
The UN IPCC is made up of 200 of the world’s leading climate scientists. Its stated position is unequivocal. Climate change and global warming are a clear and present threat and they are caused by the vast amounts of greenhouse gases (principally in the form of carbon dioxide) that we as human beings have been pumping into the world’s atmosphere since the dawn of the Industrial Revolution by our continuing use of fossil fuels. As Grover and Peschek argue, ‘The continuous burning of fossil fuels portends a global climate catastrophe’ (Grover and Peschek 2014: 149). Figure 1.1 shows the amount of greenhouse gases being pumped into the atmosphere from 1900 to 2015 as measured in parts per million (ppm). It illustrates a clear and significant upward trend in such emissions.
According to data from the world meteorological organisation, in 2015 global greenhouse gas emissions averaged across the year reached the milestone of 400ppm for the first time. The US National Oceanic and Atmospheric Administration (NOAA) greenhouse gas monitoring station at Mauna Loa, Hawaii, predicts that such concentrations are here to stay for the foreseeable future and will not drop below this level for many generations. The world has not seen such concentrations of greenhouse gases in the atmosphere for several million years since a time when the Arctic was ice-free, and sea levels were 40 metres higher than today.
Figure 1.1 Atmospheric greenhouse gases 1900–2015
Source: Base data compiled by Earth Policy Institute from Intergovernmental Panel on Climate Change (IPCC) and National Oceanic and Atmospheric Administration (NOAA), plus data from World Meteorological.
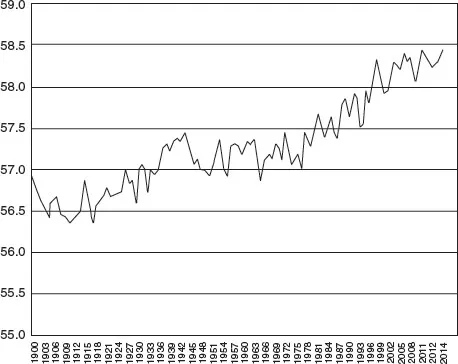
The consequence of this continued rise in greenhouse gas emissions has been a steady but inexorable rise of global surface temperatures. Figure 1.2 illustrates the changes in the temperature of the earth’s atmosphere in degrees Fahrenheit from 1900 to 2014. Of course there are variations from year to year, but there is a clear upward trend. It is important to note that 20 of the hottest 21 years since records began in 1860 have occurred in the last 25 years.
The latest evidence from the IPCC shows that global greenhouse gas emissions continue to rise, with the possibility of global temperature increases above 2°C within the next 20 to 30 years (IPCC 2013). The 2°C figure (equivalent to 3.6°F) is significant, with many scientists now of the view that any increase beyond this would take us into unchartered territory, with the world experiencing more and more severe and unusual weather events. In spite of the clear evidence of human induced climate change there is a significant climate change denial lobby, backed by big oil, which seeks to undermine the science at every turn. This lobby is particularly prevalent in the US with bodies such as the Ayn Rand Institute, the Cato Institute and the Heritage Foundation. I shall return to this theme in subsequent chapters.
Figure 1.2 Average global surface temperatures 1900–2014
Source: Base data compiled by Earth Policy Institute (2014) from National Aeronautics and Space Administration (NASA) and Goddard Institute for Space Studies (GISS).
In its 2011 World Energy Outlook (WEO), the International Energy Authority (IEA), which has traditionally adopted a somewhat conservative approach to climate change, stated that the world was locking itself into an unsustainable energy future. The WEO has set out what it calls a ‘450 scenario’ which traces an energy path consistent with meeting the globally agreed goal of limiting the temperature rise to 2°C (3.6°F). 80 per cent of energy related emissions are already locked in by existing infrastructure, such as power stations and factories. ‘Without further action by 2017,’ the IEA concludes, ‘the energy related infrastructure then in place would generate all the CO2 emissions allowed in (the) 450 scenario up to 2035’ (IEA 2011).
Who is to blame?
So who are the biggest culprits when it comes to greenhouse gas emissions? Historically the US has been the largest contributor to greenhouse gas emissions (Friedrich and Damasson 2014). In 2014, China (with a population of 1.3 billion) was the largest emitter of greenhouse gas emissions, accounting for 30 per cent of total emissions. The US (with a population some 310 million) was second, accounting for some 15 per cent of emissions. The European Union accounted for 10 per cent of total emissions (PBL Netherlands 2015) This places a major responsibility on the US (alongside China and the European Union) to show political leadership in tackling climate both at home and on the global level. It is an argument I shall return throughout this book but in particular in Chapter 6.
The impact of climate change
It has been argued that
Like a distant tsunami that is only a few metres high in the deep ocean but rises dramatically as it reaches shallow coastal waters, the great wave of climate change has snuck upon people – and is now beginning to bite.
(Flavin and Engelman 2009: 6)
Across the globe evidence is mounting of the impact of climate change. As Bonds has argued, ‘Global warming is transforming the Arctic’ (Bonds 2016). Sea ice in the Arctic Sea has shrunk to the smallest level ever recorded based on data from the National Snow and Ice Data Center (NSIDC) in Colorado. Satellite images from 2012 show that a rapid melt has reduced the area of frozen sea to less than 3.3 million square kilometres, less than half that of 40 years ago. In the period from 2010 to 2012 the volume of Arctic ice fell by 14 per cent. However, it is only fair to point out that ice levels in the Arctic did stage a revival in 2013 with the volume of ice going up by 41 per cent. What is the explanation for this? As Carrington points out, this revival was the result of cooler temperatures in 2013 (Carrington 2017). So does this data undermine the case against climate change and strengthen the argument of the climate change denial lobby? Professor Rachel Tilling of University College London who led the Arctic study commented that while the upturn in Arctic ice volume was surprising, she rejected the idea of a wider recovery of the ice cap, arguing that climate change was still driving average temperatures up despite significant variations from year to year (Carrington 2017).
Indeed data published by the US National Snow and Ice Data Centre (NSIDC) in March shows that ice in the Arctic has fallen to a new winter time low; a consequence of unusually high temperatures in the polar regions. The ice cap grows during the winter months and usually reaches its maximum in early March. However, the maximum for March 2017 was 14.4 square kilometres lower than any year in the 38 years of satellite tracking. For Mark Serreze, the director of NSIDC, such developments are unprecedented. ‘I have been looking at Arctic weather patterns for 35 years’ said Serreze ‘and we have never seen anything close to what we’ve experienced these past two winters’ (Carrington 2017). 2017 is the third year in a row that the Arctic’s winter ice has set a new low. Such major loss of ice poses significant threats to the planet with rising sea levels and more extremes of weather.
There are other pressures on the Arctic. It is estimated that the region holds up to 25 per cent of the world’s remaining oil and gas reserves. The delicate eco system of the Arctic is coming under increasing threat as the melting ice eases the logistical difficulties of extracting oil. This presents commercial opportunities for oil corporations with further consequences for the Arctic and the planet generally as more and more greenhouse gases are pumped into the atmosphere. Late on in his Presidency, Barack Obama used his executive authority to introduce a five year moratorium on drilling in the US-controlled Arctic region. What the election of Donald Trump as President means for the region time alone will tell.
The 2006 Stern Report warned of the severe environmental, economic and social consequences of climate change with increasing sea levels increasing the risk of flooding and threatening water supplies to one sixth of the world’s population. Delicate eco systems were coming under threat. Stern argued that urgent action was needed (Stern 2006: 56). Over a decade later the situation is even more grave and urgent. The physical impact of climate change is becoming more and more evident. Rising sea levels threaten the livelihoods of millions of people with all that means for poverty, social justice and political and social instability.
In the specific context of the US, evidence suggests that climate change will lead to rising sea levels which will threaten many coastal cities. Data also points to a loss of between 30 to 70 per cent of the snow pack in the Rocky Mountains; highly significant as it provides much of the water for the American west (Gertner 2007). It is forecast that rainfall in the west of the US will decrease by 20 per cent between 2040 and 2060 (Revkin 2008). Indeed there has been a five year drought in the state of California, broken only in early 2017 with storms and torrential downpours. In addition, climate change has reduced the Sierra snowpack, a vital stockpile of fresh water for California. These are major environmental challenges which need a political and policy response.
The US National Climate Assessment Report published in 2013 showed the impact of increasing storm surges, floods and droughts on the lives of Americans (NCADAC 2013). Research published by the California EPA shows that lakes are warming, sea levels are rising, and wildfires are spreading as the impact of climate takes hold throughout the state.
A recent report by the NOAA shows that 2012 was the warmest year on record for the contiguous US. The average temperature for the year was 55.3°F, a full degree warmer than the previous record year, 1998, and 3.3 degrees above the entire average of the twentieth century (NOAA 2013).
Furthermore, research from the NOAA shows that 2016 was the second warmest year on record for the contiguous US (NOAA 2017a). However, what is particularly striking about 2016 is how widespread the warming was. ‘The breadth of the 2016 warmth is unparalleled in the nation’s climate history,’ explains the NOAA ‘no other year had as many states (in the US) breaking or close to breaking their warmest annual average temperature’ (Romm 2017). For the world’s leading climatologist, Michael Mann, ‘2016 was an exclamation point, another record warm year in a record warm decade, filled with unprecedented, increasingly devastating extreme weather events’. He went on, ‘It was mother nature’s warning’ to the climate change deniers in the Trump administration (Romm 2017).
Furthermore, data from the NOAA shows that the 2016 globally averaged surface temperature ended as the highest since records began in 1860. This marked three consecutive years of record warmth for the globe. These findings were backed up by separate research by NASA (NOAA 2017b). Furthermore, 14 out of the last 15 years have been the hottest on record.
The national intelligence council (NIC), a government advisory agency, looks at the strategic challenges facing the US and the world. In its 2016 report, it argues that ‘climate change, environmental, and health...