- 316 pages
- English
- ePUB (mobile friendly)
- Available on iOS & Android
eBook - ePub
Handbook of Coastal Processes and Erosion
About this book
The objective of this book is to focus on the physical processes that cause coastal erosion.Many scientists and engineers have focused their research on the entire range of physical processes from the waves and the currents in the nearshore to the response of the beach, via sand transport, resulting in a changing coastal morphology. Of these many processes, this book focuses only on those which directly relate the generation of coastal erosion. Some chapters deal exclusively with the physical processes, while others provide examples of erosion problems although most of the chapter topics have clear implications for issues of coastal-zone management, these issues are not belaboured as several other books are already available in this area. The objective is to provide state-of-the-art presentation of the science of coastal erosion processes.
Trusted by 375,005 students
Access to over 1.5 million titles for a fair monthly price.
Study more efficiently using our study tools.
Information
Chapter 1
BEACH PROCESSES AND EROSION — AN INTRODUCTION
Paul D. Komar
Whether it be on a barrier island under the onslaught of a hurricane or the long-term wearing away of rocky sea cliffs, coastal erosion is the result of a complex interaction of physical processes. Depending on the circumstances, the water motions of waves, tides, storm surge, and nearshore currents combine and interact with the coastal land which in turn has considerable inherent variability.
The purpose of this chapter is to briefly summarize these several agents that play a role in coastal erosion. Many of these processes will be dealt with at greater length in subsequent chapters, with more details on the resulting erosion. This chapter will serve only as an abstract for this later material, and to present an introduction to waves and currents that will serve as background material needed in later chapters. More complete reviews on coastal processes in general can be found in Wiegel,54 King,28 Silvester,48 Komar,30 and Horikawa.24
This brief summary will begin with waves — certainly the primary agent in coastal erosion — examining their generation, measurement, travel, and eventual breaking at the coastline. These waves generate nearshore currents which in turn transport the beach sediments, a movement which results in a rearrangement of the shoreline with possible sites of erosion.
Waves — Their Generation, Travel, and Arrival at the Coast
The waves one sees every day on the ocean, and those primarily responsible for coastal erosion, are generated by winds blowing over the water surface. There are, of course, waves such as the tsunami that are not generated by winds, and although they can be extremely destructive their occurrence is too rare for them to be a significant factor in coastal erosion and so will not be considered here.
Wind-generated waves are important as energy-transfer agents; first obtaining their energy from the winds, transfering it across the expanses of the oceans, and then delivering it to the coastal zone where it can be the primary cause of erosion or can generate a variety of nearshore currents and sand transport patterns. This transferral of energy is depicted schematically in Figure 1. The generation of the waves is primarily dependent upon three storm factors: the speed of the wind, the duration of the storm, and the fetch area over which the storm occurs. The duration is important in that the longer the winds have been blowing, the greater the amount of energy that can be transferred to the growing waves. The fetch area has a similar effect; once the waves travel out of the storm area they no longer acquire additional energy, so that the larger the fetch area, the more energy the waves can potentially obtain.
The simplest type of wave is shown in Figure 2, characterized by a height, H, length, L, and period, T, the time it takes for successive crests to pass a fixed position such as the piling shown. However, waves in the storm area, termed sea (Figure 1), do not fit this ideal picture but instead are a complex pattern of wave crests and troughs, with no two waves seeming to have the same height or period. If an individual wave crest is followed it often is observed to progressively decrease in height and eventually disappear. This complex pattern of waves results because a storm does not simply generate waves of one fixed height and period, but instead, a whole range or spectrum is generated. When the wind first blows across an initially quiet body of water only small ripples are formed with periods less than 1 second and heights of only a couple of centimeters. As time passes, waves with longer and longer periods will be formed, but small ripples will continue to be present and waves with a range of periods will now exist. The longer-period waves have longer wave lengths, and this also permits them to achieve greater heights without breaking and thereby losing energy. Concomitant with the progressive increase in wave periods present in the area of generation is an increase in wave heights.
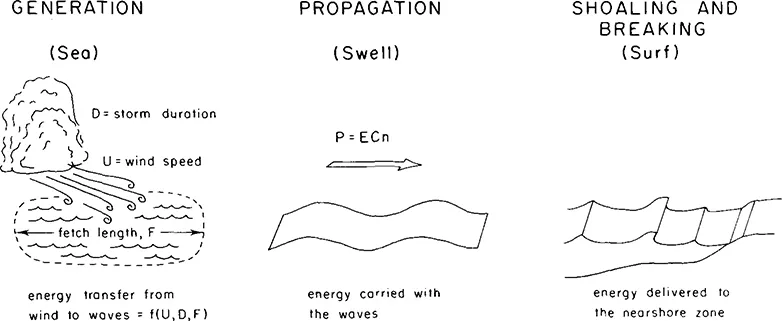
FIGURE 1. The generation of waves by storm winds. The energy transfer depending on the factors illustrated, followed by the transfer of energy across the sea as swell waves, finally arriving at the coastline where the energy is important to many nearshore processes.
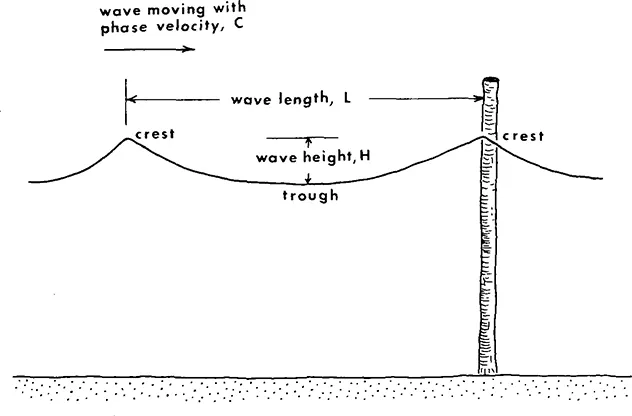
FIGURE 2. The parameters that, along with the wave period T, describe simple oscillatory waves. (From Komar, P. D., Beach Processes and Sedimentation, Prentice-Hall, Englewood Cliffs, N.J., 1976. With permission.)
Characterizing the waves in the area of generation is obviously more difficult than in the case of the simple sinusoidal wave of Figure 2 which could be defined by one height and period. Once a record is obtained of the water-surface elevations, determined by a variety of techniques including water-pressure sensors, wave staffs, surface “glitter” and other remote sensing methods, the analysis usually takes one of two possible paths (Figure 3). A statistical analysis of wave heights can be performed, noting the maximum wave height in the record, the average height, or a root-mean-square wave height. A commonly used statistical wave height is the significant wave height, Hs, defined as the average of the highest one third of the waves. Its choice was based on the impression that in many applications the larger waves are more important than the small waves, and Hs thereby provides a more representative wave measure than, for example, the average wave height. It has also been shown that Hs roughly corresponds to a visual estimate of a representative wave height in that the observer naturally tends to weight his observation toward the larger waves. It has been demonstrated theoretically38 and by measurements18,44 that under fully developed storm waves these statistical wave heights form well-defined ratios. For example, the ratio of Hs to the average wave height is approximately 1.56, and its ratio to the root-mean-square wave height is 1.42. The maximum wave height observed in a wave record depends on the length of that record, so there is no fixed value for its ratio with the other wave statistics. One can also define a significant wave period or average wave period, but these have somewhat less physical reality than the corresponding wave heights, and as we shall see, their use can lead to mistaken results.
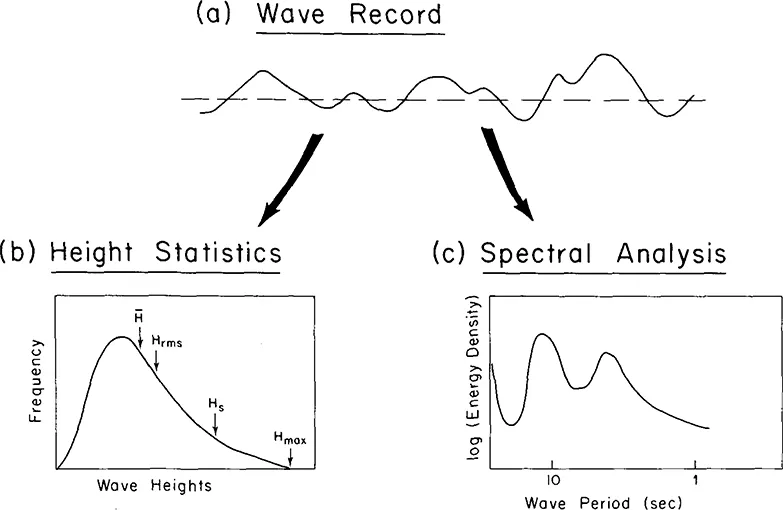
FIGURE 3. The analysis of a wave record (a) usually involves a consideration of the statistics of the wave heights (b) or a spectral analysis approach (c).
An alternate and more realistic approach to analyzing waves is through spectral analysis (Figure 3). This approach views the complex wave patterns as the sum of many simple sinusoidal waves of differing periods and heights (energies). A summation of even a few sinusoidal waves quickly leads to complex wave patterns such as those observed in the area of generation. For example, the highest waves found under a storm are usually produced by the chance summation of several of the simpler waves, a summation which may occur for only a few seconds — after which the simple waves move apart and no longer sum to form the exceptionally large wave. Spectral analysis is the reverse of this summation, starting with the observed complex pattern as in Figure 3(a) and breaking it down into the individual sinusoidal waves. Figure 3(c) depicts schematically what is typically obtained with such a technique. The spectrum shows the amount of energy contained at each wave period or frequency, the energy being proportional to the wave height squared. Therefore, the spectrum indicates the heights of all the sinusoidal waves that when summed would yield the complex waves measured. In the spectrum illustrated most of the energy is seen to occur at two periods, 12 and 4 seconds indicating that there were two principal sets of waves present, although it is seen that a wide range of periods from less than 1 second to greater than 12 seconds was present. The rapid upturn at very high periods would be caused by water-level changes due to tides, the analysis evaluating this change as a long-period wave (which, of course, the tide is). This illustrative spectrum is typical in that at a coastal site one commonly records waves arriving from a distant storm, the 12 second peak, as well as ...
Table of contents
- Cover
- Title Page
- Copyright Page
- Preface
- Editor-in-Chief
- The Editor
- Advisory Board
- Contributors
- Dedication
- Table of Contents
- Chapter 1 Beach Processes and Erosion — an Introduction
- Chapter 2 Edge Waves and the Configuration of the Shoreline
- Chapter 3 Morphodynamics of Beaches and Surf Zones in Australia
- Chapter 4 The Erosion of Siletz Spit, Oregon
- Chapter 5 Barrier Islands
- Chapter 6 Patterns and Prediction of Shoreline Change
- Chapter 7 Models for Beach Profile Response
- Chapter 8 The Great Lakes as a Test Model for Profile Responses to Sea Level Changes
- Chapter 9 Coastal Erosion in Response to the Construction of Jetties and Breakwaters
- Chapter 10 Computer Models of Shoreline Changes
- Chapter 11 Principles of Beach Nourishment
- Chapter 12 Processes of Sea Cliff and Platform Erosion
- Chapter 13 Beach Processes and Sea Cliff Erosion in San Diego County, California
- Chapter 14 Erosion of the U.S. Shorelines
- Index
Frequently asked questions
Yes, you can cancel anytime from the Subscription tab in your account settings on the Perlego website. Your subscription will stay active until the end of your current billing period. Learn how to cancel your subscription
No, books cannot be downloaded as external files, such as PDFs, for use outside of Perlego. However, you can download books within the Perlego app for offline reading on mobile or tablet. Learn how to download books offline
Perlego offers two plans: Essential and Complete
- Essential is ideal for learners and professionals who enjoy exploring a wide range of subjects. Access the Essential Library with 800,000+ trusted titles and best-sellers across business, personal growth, and the humanities. Includes unlimited reading time and Standard Read Aloud voice.
- Complete: Perfect for advanced learners and researchers needing full, unrestricted access. Unlock 1.5M+ books across hundreds of subjects, including academic and specialized titles. The Complete Plan also includes advanced features like Premium Read Aloud and Research Assistant.
We are an online textbook subscription service, where you can get access to an entire online library for less than the price of a single book per month. With over 1.5 million books across 990+ topics, we’ve got you covered! Learn about our mission
Look out for the read-aloud symbol on your next book to see if you can listen to it. The read-aloud tool reads text aloud for you, highlighting the text as it is being read. You can pause it, speed it up and slow it down. Learn more about Read Aloud
Yes! You can use the Perlego app on both iOS and Android devices to read anytime, anywhere — even offline. Perfect for commutes or when you’re on the go.
Please note we cannot support devices running on iOS 13 and Android 7 or earlier. Learn more about using the app
Please note we cannot support devices running on iOS 13 and Android 7 or earlier. Learn more about using the app
Yes, you can access Handbook of Coastal Processes and Erosion by Paul D. Komar in PDF and/or ePUB format, as well as other popular books in Biological Sciences & Environmental Science. We have over 1.5 million books available in our catalogue for you to explore.