- 488 pages
- English
- ePUB (mobile friendly)
- Available on iOS & Android
eBook - ePub
Handbook of Energy Utilization In Agriculture
About this book
The aim of this volume is to collect and present available data, both published and unpublished, on energy use in agriculture and forestry production. Energy analyses for some sciences such as ecology are not new, but their applications to agriculture started in 1973. These analyses have grown rapidly in number and complexity. This handbook is intended for agriculturalists and others concerned with energy use in crop, livestock, and forestry production.
Trusted by 375,005 students
Access to over 1.5 million titles for a fair monthly price.
Study more efficiently using our study tools.
Information
Energy Inputs and Outputs for Crop Systems—Fruits and Tree Crops
Energy Use in Low, Medium, And High Density Apple Orchards — Eastern U.S.
Richard C. Funt
During the 1975-1977 period the utilized commercial apple crop was 2.8 million metric tons.*2 Washington, New York, Michigan, and Pennsylvania are the leading apple producing states. Washington produces more than one third of the U.S. total and ships apples to eastern markets, especially New York City. In the eastern U.S., New York, Pennsylvania, Virginia, and North Carolina are the leading producers.5
Apples are second (bananas are first) among noncitrus purchases of fresh fruit in the U.S. About 56% of all apples sold over the past 4 years were sold on the fresh market.6 The processed market utilized almost 44% of the crop with apple juice and apple sauce as the chief items. Apple juice amounted to 43% of apples processed (16% of total production) while sauce averaged 26.5%.6
Generally, 5 to 6% of the apples have been exported.2 However, in the 1976 to 1977 season, U.S. apple exports of 6.3 million bushels (120,054 metric tons) set a postWorld War II record.2 Exports to Europe increased due to the lowest yield in 15 years and to the Mideast (Saudi Arabia) and Far East (Hong Kong).
Generally apples are grown on sites that are protected from freezing temperatures during bloom. Nationally, only 10% of the deciduous fruit and nut crops require frost protection.1 Orchard heaters and wind machines utilize LP and natural gas, gasoline, diesel, and electric motors. In the Pacific Northwest, irrigation is depended upon for apple production. Supplying irrigation water can account for 40% or more of energy used in production.1 However yields are generally higher in the Pacific Northwest than in the East due to controlled watering. Generally few growers in the East use frost protection or irrigation in their orchards.
Nationally, large-sized apple trees require larger equipment and use larger amounts of fuel than smaller sized trees.4 Some growers in the East are using large mechanical harvesters rather than hand labor.
Pesticide usage can account for 11% of the total energy expended in orchards while field operations (tillage, pesticide application, etc.) account for 12% of the total energy use.1 There is very little difference in energy usage between high-quality apples grown for processing or fresh market.4
Apples, whether they are marketed processed or fresh, are stored in common or controlled atmosphere refrigerated storage at 32°F (0°C) and 90% relative humidity. Generally, 46% of all apples are stored.3 In the East, 40 to 55% (6 year average = 44.1%) of the stored apples are sold between October 31 and January 31 and less than 6.4% of all apples are left in storage after April 30.3
The energy tables for eastern apple production were developed from an economic doctoral thesis.4 The thesis data is based on a typical Pennsylvania fruit farm having 44.4 acres (17.8 ha) of apple trees, 20 acres (8.0 ha) of other fruit crops, 85.6 acres (34.2 ha) of open land, and 25 acres (10.0 ha) of farmstead and nonproductive areas. The author was born and raised on a similar farm in the leading fruit production area of the state and utilized this operation for developing the data.
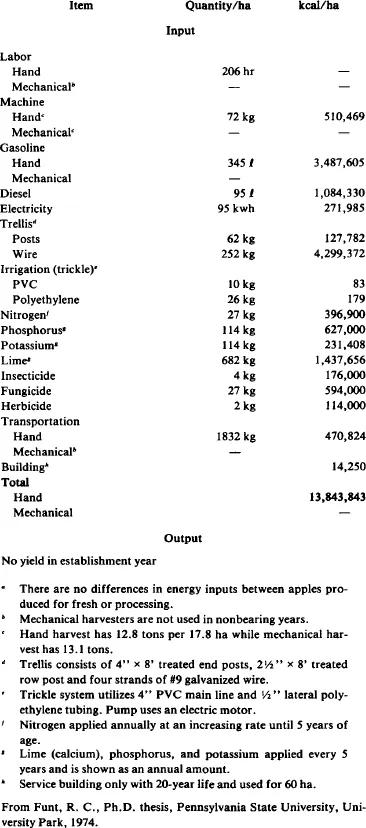
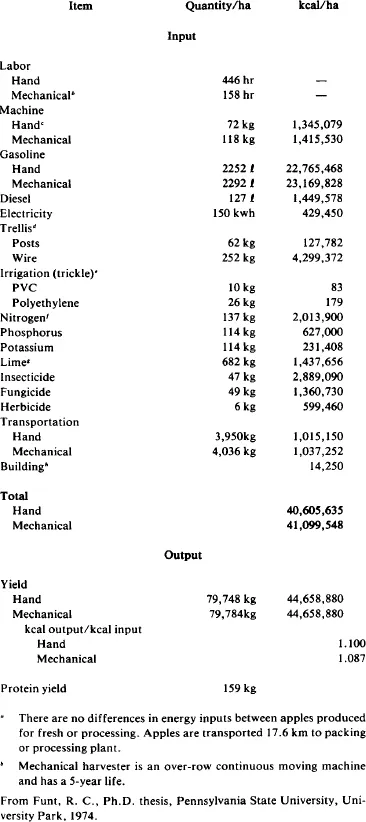
The data presented in Tables 1 through 9 represent low, medium, and high density apple orchards with selected ages of 1, 10, and 20 years. Only the high-density orchard is irrigated and no orchards utilize frost control. The high-density orchard has a trellis system for support.
The low- and medium-density orchards show comparisons using hand or a mechanical harvester which is a shake-and-catch system moving and stopping at each tree. In the high-density system, an over-the-row harvester moves continuously down the row at 1.7 km per hour and is capable of harvesting 28,600 kg of fruit per hour. All fruit is transported by truck 17.6 km to a packing plant. No refrigeration or grading energy values are included.
The equipment utilized in the low- and medium-density systems are larger and have higher horsepower requirements than the equipment used in the high-density system. For example, large air-blast sprayers with over 100 horsepower motors are necessary for low density while small PTO driven air blasts are used in the high-density system. However, high-density systems require greater travel time through the orchard due to a greater number of rows than the low- or medium-density systems.
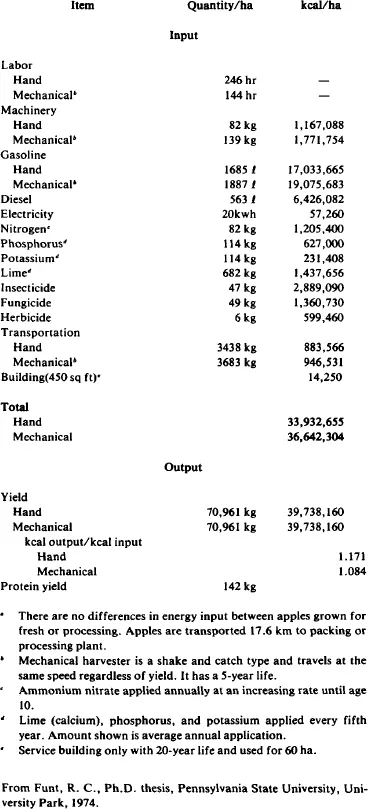
The results in Tables 1 through 9 indicate that the largest use of energy (kcal/ha) is fuel (gasoline and diesel). Generally 60 to 70% of the energy use can be attributed to fuel. Pesticide energy use ranged from 7 to 20% with an average of 14% over all densities and years of production. This is in general agreement with a U.S. Department of Agriculture publication where 44% of total direct energy went to fuel for orchard crops and pesticides represented 15.3% for apples.1 Differences between these studies are due to specific densities and tree age here and general orchard conditions plus frost protection in the USDA publication.
Generally, it takes the same amount of pesticide per hectare regardless of yield. Therefore increasing yield utilizes pesticides more efficiently. Also greater knowledge and timing of pesticides and smaller droplet size will decrease pesticide usage.
Fuel usage can be reduced with small-size trees because small equipment can be used. However, fuel usage for transport increases as yield increases per hectare, but not per kg.
The input-output ratio was the lowest in the low-density system. The medium- and high-density systems were higher, but nearly equal to each other. High-density systems could be more efficient in labor and energy if the support system was eliminated. New rootstocks and interstem trees could be used to accomplish this goal.
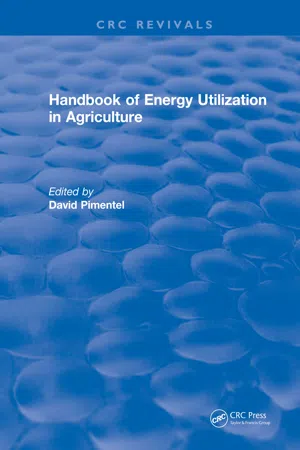
Table 1 Energy Input Per Hectare For Low Density (165 Trees/Ha), Hand Or Mechanically Harvested Nonirrigated Apples For The First-Year (Establishment), Eastern Region U.S.a
From Funt, R. C., Ph.D. thesis, Pennsylvania State University, University Park, 1974. (With permission.) Table 2
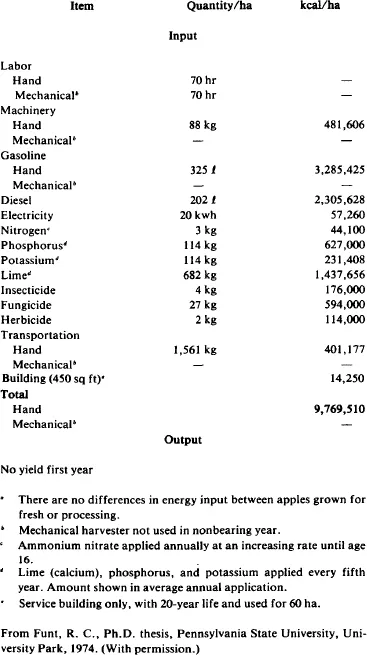
Table 2 Energy Input Per Hectare For Low Density (165 Trees/Ha) Hand Or Mechanically Harvested Nonirrigated Apples For The Tenth Year After Establishment, Eastern Region U.S.a

From Funt, R. C., Ph.D. thesis, Pennsylvania State University, University Park, 1974.
Table 3 Energy Input Per Hectare For Low Density (165 Trees/Ha) Hand Or Mechanically Harvested Nonirrigated Apples For The Twentieth Year After Establishment, Eastern Region U.S.a
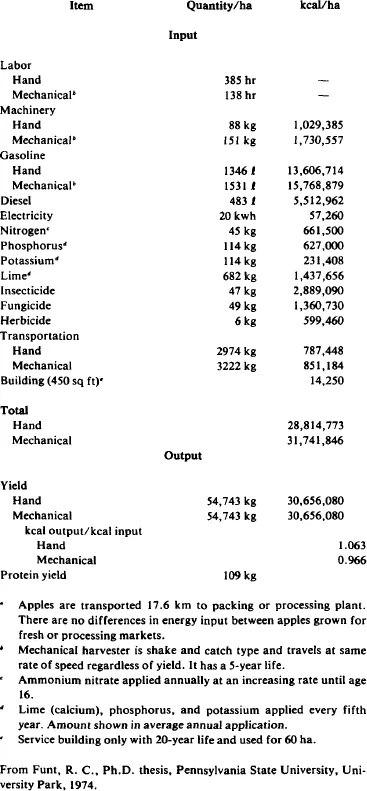
Table 4 Energy Input Per Hectare For Medium Density (453 Trees/Ha), Hand Or Mechanically Harvested Nonirrigated Apples For The First Year (Establishment), Eastern Region U.S.a
From Funt, R. C., Ph.D. thesis, Pennsylvania State University, University Park, 1974.
Table 5 Energy Input Per Hectare For Medium Density (453 Trees/Ha), Hand Or Mechanically Harvested Nonirrigated Apples For The Tenth Year After Establishment, Eastern Region U.S.a

From Funt, R. C., Ph.D. thesis, Pennsylvania State University, University Park, 1974.
Table 6 Energy Input Per Hectare For Medium Density (453 Trees/Ha), Hand Or Mechanically Harvested Nonirrigated Apples For The 20Th Year After Establishment, Eastern Region U.S.a
From Funt, R. C., Ph.D. thesis, Pennsylvania State University, University Park, 1974.
Table 7 Energy Input Per Hectare For High Density (1512 Trees/Ha) (Trellis) Supported, Hand Or Mechanically Harvested, Irrigated (Trickle System) Apples For The First Year (Establishment), Eastern Region U.S.a
From Funt, R. C., Ph.D. thesis, Pennsylvania State University, University Park, 1974.
Table 8 Energy Input Per Hectare For High Density (1512 Trees/Ha) (Trellis) Supported, Hand Or Mechanically Harvested, Irrigated (Trickle System) Apples For The Tenth Year After Establishment, Eastern Region U.S.a
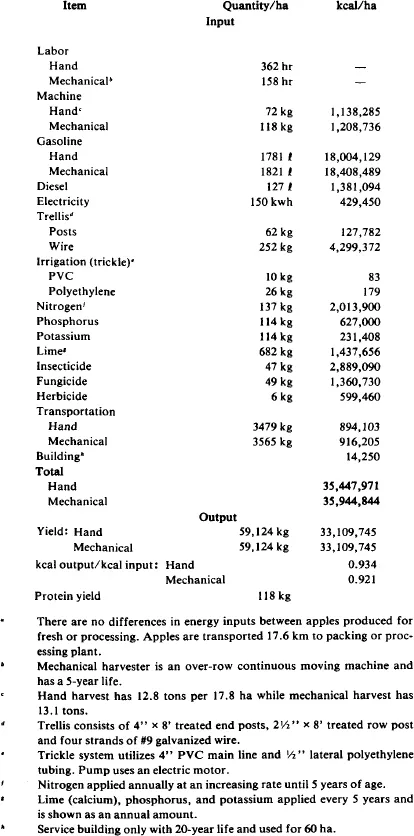
Table 9 Energy Input Per Hectare For High Density (1512 Trees/Ha) (Trellis) Supported, Hand Or Mechanically Harvested, Irrigated (Trickle System) Apples For The Twentieth Year After Establishment, Eastern Region U.S.a
From Funt, R. C., Ph.D. thesis, Pennsylvania State University, University Park, 1974.
Reference
1. A Guide to Energy Saving 舒 For the Orchard Grower, U.S. Department of Agriculture, Federal Energy Administration, 1977.
2. Burrows, F., Apple Exports and the Mid...
Table of contents
- Cover
- Title Page
- Copyright Page
- Preface
- The Editor
- Advisory Board
- Contributors
- Table of Contents
- Introduction
- Energy Values for Agricultural Inputs
- Energy Inputs and Outputs for Crop Systems—Field Crops
- Energy Inputs and Outputs for Crop Systems — Vegetables
- Energy Inputs and Outputs for Crop Systems—Fruits and Tree Crops
- Energy Inputs and Outputs for Livestock Production Systems
- Energy Inputs and Outputs for Marine Fishery Production
- Energy Inputs and Outputs for Forestry Production
- Index
Frequently asked questions
Yes, you can cancel anytime from the Subscription tab in your account settings on the Perlego website. Your subscription will stay active until the end of your current billing period. Learn how to cancel your subscription
No, books cannot be downloaded as external files, such as PDFs, for use outside of Perlego. However, you can download books within the Perlego app for offline reading on mobile or tablet. Learn how to download books offline
Perlego offers two plans: Essential and Complete
- Essential is ideal for learners and professionals who enjoy exploring a wide range of subjects. Access the Essential Library with 800,000+ trusted titles and best-sellers across business, personal growth, and the humanities. Includes unlimited reading time and Standard Read Aloud voice.
- Complete: Perfect for advanced learners and researchers needing full, unrestricted access. Unlock 1.5M+ books across hundreds of subjects, including academic and specialized titles. The Complete Plan also includes advanced features like Premium Read Aloud and Research Assistant.
We are an online textbook subscription service, where you can get access to an entire online library for less than the price of a single book per month. With over 1.5 million books across 990+ topics, we’ve got you covered! Learn about our mission
Look out for the read-aloud symbol on your next book to see if you can listen to it. The read-aloud tool reads text aloud for you, highlighting the text as it is being read. You can pause it, speed it up and slow it down. Learn more about Read Aloud
Yes! You can use the Perlego app on both iOS and Android devices to read anytime, anywhere — even offline. Perfect for commutes or when you’re on the go.
Please note we cannot support devices running on iOS 13 and Android 7 or earlier. Learn more about using the app
Please note we cannot support devices running on iOS 13 and Android 7 or earlier. Learn more about using the app
Yes, you can access Handbook of Energy Utilization In Agriculture by David Pimentel in PDF and/or ePUB format, as well as other popular books in Biological Sciences & Biology. We have over 1.5 million books available in our catalogue for you to explore.