![]()
1
The Water Nexus and Desalination
1.1 Introduction: The Twenty-First Century Context for the Pursuit of Sustainable Water Resources
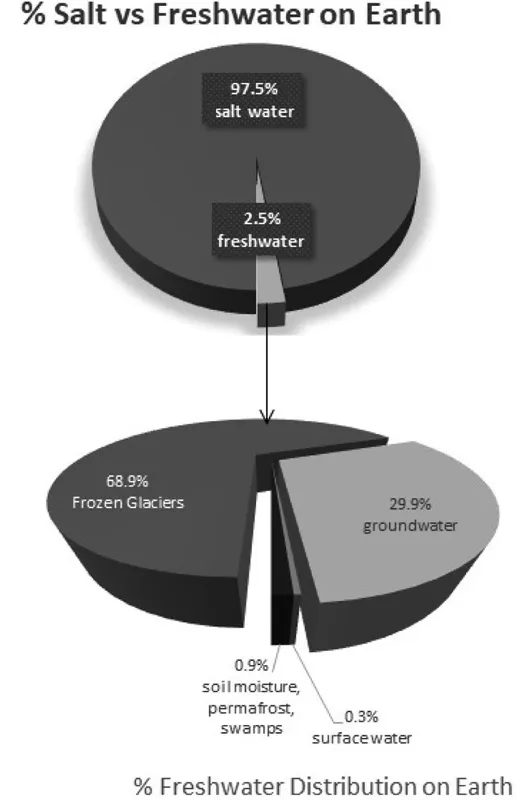
Humanity embarked on the twenty-first century facing a number of challenges leaving politicians, visionaries and academics pondering on elusive solutions for a long time to come. Some such major challenges include water resources, energy, food security and population. This is by no means an exhaustive list. However, the four challenges mentioned are intimately related. By far, availability and access to clean freshwater constitute the major concern to decision makers globally. Indeed, the inexorable increase in the world population over the past decades put a considerable strain on Earth’s freshwater. While planet Earth has an immense salt water inventory in the form of oceans and seas, freshwater constitutes a mere 2.5% of the global total water and from this fraction, nearly 69% of freshwater is locked as frozen glaciers and permanent icecaps, leaving just over 30% of freshwater available as groundwater and 0.3% of freshwater available as surface water. Surface freshwater constitutes a tiny 0.3% of freshwater available and the remaining 0.9% are accounted for as soil moisture, permafrost and swamps. This remarkable and striking estimate reported by Igor Shiklomanov [1] still remains a valuable reference for the global freshwater inventory of planet Earth. Figure 1.1 depicts Earth’s global water and freshwater distribution.
Unlike other natural resources, water circulates naturally according to the global hydrological cycle offering the possibility to recharge natural and man-made water catchments. However, according to Oki and Kanae [2], it is the flow of water that should be the focus rather than the stock in the assessment of water resources. Oki and Kanae [2] also pointed out that due to the long time it may take to recharge groundwater reservoirs naturally to their original volume stored, if ever, groundwater has sometimes been called “fossil water.”
FIGURE 1.1
Earth’s global water and freshwater distribution.
This is particularly significant when groundwater is being withdrawn in many parts of the world at a rate that exceeds natural recharging [3,4,5] and that globally, about 70%–80% of the total water consumed is used in agriculture [1,6].
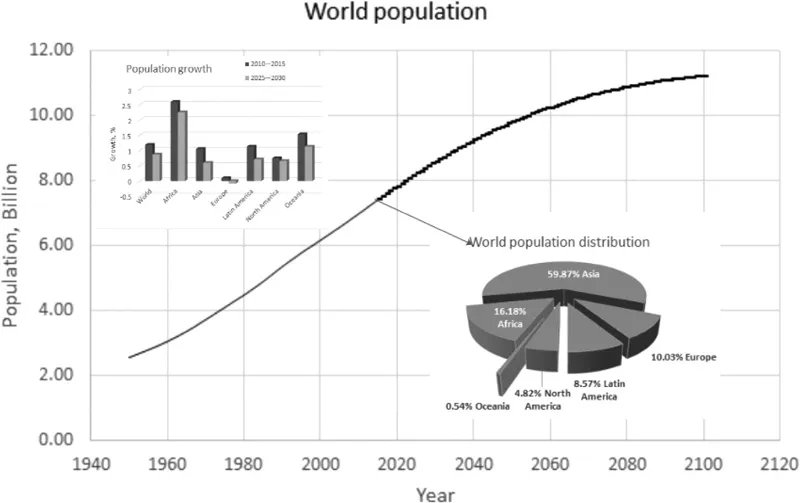
The surge in freshwater consumption is primarily due to an increasing world population that needs food from agricultural activity, industrial activities and urban/rural development to maintain or improve its lifestyle. The most recent United Nations population census [7] depicts an unprecedented upward trend in the past decades, reaching 7.63 billion in 2017 and projected to reach over 10 billion past the 2050 horizon. Figure 1.2 shows the world population trend from the 1950s to the 2100 horizon. It can be seen that the major fraction of the world population is currently (2017) located in Asia (59.87%), followed by Africa (16.18%), Europe (10.03%), Latin America (8.57%), North America (4.82%) and finally Oceania (0.54%). The population growth in Figure 1.2 indicates that the global population will continue an upward trend with the exception of Europe where a negative growth may be experienced past the 2025 horizon. Because the uneven distribution of renewable freshwater reserves (RFWR) has been somewhat exacerbated by the climate system, most regions in the world, regardless of the status of economic development or wealth, have been affected by water shortages intermittently or permanently. Consequently, a measure of water scarcity has been put forward in the form indices commonly called water scarcity indices. These indices have been reviewed by Brown and Matlock [8]. However, the simplest water scarcity index covered by Oki and Kanae [2] has been used to map water-stressed regions in the world. This water scarcity index is represented by the following equation:
FIGURE 1.2
The world population trend from the 1950s to the 2100 horizon.
TABLE 1.1
Water Scarcity Scale
Rws < 0.1 | No water stress |
0.1 ≤ Rws < 0.2 | Low water stress |
0.2 ≤ Rws < 0.4 | Moderate water stress |
Rws ≥ 0.4 | High water stress |
where Rws is the water scarcity index, W is the annual abstraction, S is the desalinated water and Q is the annual available water. From this definition, a water scarcity scale system [9] has been proposed, as seen in Table 1.1 and used to identify regions with Rws equal or greater than 0.4. These regions include northern China, the region bordering Indian and Pakistan, the whole of the Middle-East and North Africa (MENA) and much of the western regions of the United States of America. Parts of southern Europe also suffer from water scarcity.
Tables 1.2 and 1.3 show the water withdrawal by source and usage sector in the MENA region and water withdrawal by sector (including desalination) as % of total, respectively [6].
Table 1.2 shows that the Arabian Gulf region has one of the highest groundwater consumption in the world for agriculture while Africa has the highest proportion of its freshwater resource used for agriculture. The world average for water usage in agriculture is 69%. The large water consumption for agriculture and indirectly for food production in all forms led to the introduction of a particular footprint called “water footprint” (akin to the carbon footprint) [10,11,12]. Ironically, most healthy foods (vegetables) have a rather large water footprint [13,14]. This has profound implications on the meaning of sustainability of freshwater supplies. In other words, water security is a global issue and truly deserves the phrase “water nexus” [15,16,17,18].
Given the status of the water scarcity globally, how can we increase the water supply when the hydrological water cycle is not only finite, but also exacerbated by an increasing world population and an erratic climate pattern that does not spare any region in the world?
TABLE 1.2
Water Withdrawal by Source and Usage Sector in MENA Region
1(2002) 2(2005) 3(2003) 4(2012) 5(2010) 6(2011) 7(2004)
a Combined ground and surface.
TABLE 1.3
Water Withdrawal by Sector (including Desalination) as % of Total
| Agriculture | Municipal | Industry |
World | 69 | 19 | 12 |
Africa | 81 | 15 | 4... |