Advanced imaging spectral technology and hyperspectral analysis techniques for multiple applications are the key features of the book. This book will present in one volume complete solutions from concepts, fundamentals, and methods of acquisition of hyperspectral data to analyses and applications of the data in a very coherent manner. It will help readers to fully understand basic theories of HRS, how to utilize various field spectrometers and bioinstruments, the importance of radiometric correction and atmospheric correction, the use of analysis, tools and software, and determine what to do with HRS technology and data.
- 466 pages
- English
- ePUB (mobile friendly)
- Available on iOS & Android
eBook - ePub
About this book
Trusted by 375,005 students
Access to over 1 million titles for a fair monthly price.
Study more efficiently using our study tools.
Information
1Overview of Hyperspectral Remote Sensing
Remote sensing is an advanced technology used for obtaining information about a target through the analysis of data acquired by a sensor from the target at a distance. Compared to traditional remote sensing (multispectral remote sensing, MRS), hyperspectral remote sensing (HRS) has a relatively short history of development, spanning about three decades. In this chapter, basic concepts of imaging spectroscopy and HRS are introduced, and differences between MRS and HRS are discussed. Then, the development stages of HRS with some representative missions and sensor systems in particular periods are described, and an overview of HRS applications is presented. And, finally, a perspective of HRS is provided and discussed.
1.1Concepts of Imaging Spectroscopy
1.1.1Spectroscopy
Spectroscopy (or spectrography) refers to the measurement of radiation intensity as a function of wavelength from an object and is often used to describe experimental spectroscopic methods (Wikipedia 2014a). Spectroscopic studies focus on the interaction between matter and radiated energy. Daily observations of color are related to spectroscopy. Historically, spectroscopy originated with the study of visible light dispersed according to its wavelength, as dispersed through a prism. Analyzing white light by dispersing it through a prism is an example of spectroscopy (Figure 1.1). The constituent colors consist mainly of red (620–780 nm), orange (585–620 nm), yellow (570–585 nm), green (490–570 nm), blue (440–490 nm), indigo (420–440 nm), and violet (400–420 nm). Spectroscopic data are often represented by spectrum as a function of wavelength or frequency. More recently, the definition of spectroscopy has been expanded to include the study of interactions among particles, including electrons, protons, and ions, as well as their interactions with other particles as a function of their collision energy associated with wavelength or frequency (Encyclopedia Britannica 2014). Spectroscopy also includes the study of the absorption and emission of light and other radiation by matter, as related to the dependence of these processes on the wavelength of the radiation.
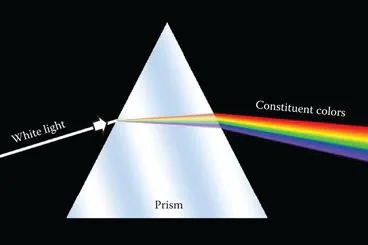
Figure 1.1An example of spectroscopy illustrated by analyzing a white light by dispersing it with a prism.
Spectroscopy has been employed by physicists and chemists in laboratories for over a century (Skoog et al. 1998). Nowadays, spectroscopic techniques have been applied in virtually all technical fields of science and technology. For example, microwave spectroscopy is used to discover the so-called three-degree blackbody radiation. Optical spectroscopy is routinely used to identify the chemical composition of matter, and to determine its physical structure (Encyclopedia Britannica 2014). Spectral measurement devices, including spectrometers, spectrophotometers, spectrographs, and spectral analyzers, are frequently used to measure spectroscopic data in practice (Wikipedia 2014a). As a result, these spectral measurements can be used to detect, identify, and quantify information about atoms and molecules. Spectroscopic techniques are also used in astronomy and remote sensing on Earth. The measured spectra are used to determine the chemical composition and physical properties (e.g., temperature and velocity) of objects and matter in space and on Earth.
1.1.2Imaging Spectroscopy
Imaging spectrometry (IS; also called hyperspectral imaging) refers to the art and science of designing, fabricating, evaluating, and applying instrumentation capable of simultaneously capturing spatial and spectral attributes of a scene with enough fidelity to preserve the fundamental spectral features that provide for object detection, classification, identification, and characterization (Eismann 2012). Compared with Eismann’s comprehensive definition of IS (2012), the U.S. Geological Survey (USGS) Speclab gives a relatively straightforward definition of IS: The main objective of IS is to measure the spectral signatures and chemical compositions of all features within the sensor’s field of view; IS data contain both spatial and spectral information from materials within a given scene; and each pixel across a sequence of continuous, narrow spectral bands contains both spatial and spectral properties (2014). Both definitions of IS are derived from the classic definition given by Goetz et al. (1985), which defines IS as an acquisition of images in many narrow contiguous spectral bands throughout the visible and solar-reflected infrared spectral bands, simultaneously. Nowadays, the IS definition covers all spectral regions (i.e., visible, near infrared, shortwave infrared, midwave infrared, and longwave infrared), all spatial domains (microscopic to macroscopic), and all targets (solid, liquid, and gas) (Ben-Dor et al. 2013). Further, an imaging spectrometer typically can collect several dozens to a few hundreds of bands of data, which enable the construction of an effectively continuous and complete reflectance spectrum for every pixel in an image (Goetz et al. 1985, Vane and Goetz 1988, Lillesand and Kiefer 1999). Figure 1.2 shows the basic concept of imaging spectroscopy. In this figure, each picture element (pixel) in an image scene has associated with it a large number of spectral data points, which allows the reconstruction of a complete reflectance or radiance spectrum. Figure 1.3 presents an “image cube” in which pixels are sampled across many narrowband images at particular spatial locations, resulting in a...
Table of contents
- Cover
- Half Title Page
- Series Page
- Title Page
- Copyright Page
- Dedication
- Contents
- Foreword
- Preface
- Acknowledgments
- Author
- Introduction
- Chapter 1 Overview of Hyperspectral Remote Sensing
- Chapter 2 Field Spectrometers and Plant Biology Instruments for HRS
- Chapter 3 Imaging Spectrometers, Sensors, Systems, and Missions
- Chapter 4 Hyperspectral Image Radiometric Correction
- Chapter 5 Hyperspectral Data Analysis Techniques
- Chapter 6 Hyperspectral Data Processing Software
- Chapter 7 Hyperspectral Applications in Geology and Soil Sciences
- Chapter 8 Hyperspectral Applications to Vegetation
- Chapter 9 Hyperspectral Applications to Environments
- Index
Frequently asked questions
Yes, you can cancel anytime from the Subscription tab in your account settings on the Perlego website. Your subscription will stay active until the end of your current billing period. Learn how to cancel your subscription
No, books cannot be downloaded as external files, such as PDFs, for use outside of Perlego. However, you can download books within the Perlego app for offline reading on mobile or tablet. Learn how to download books offline
Perlego offers two plans: Essential and Complete
- Essential is ideal for learners and professionals who enjoy exploring a wide range of subjects. Access the Essential Library with 800,000+ trusted titles and best-sellers across business, personal growth, and the humanities. Includes unlimited reading time and Standard Read Aloud voice.
- Complete: Perfect for advanced learners and researchers needing full, unrestricted access. Unlock 1.4M+ books across hundreds of subjects, including academic and specialized titles. The Complete Plan also includes advanced features like Premium Read Aloud and Research Assistant.
We are an online textbook subscription service, where you can get access to an entire online library for less than the price of a single book per month. With over 1 million books across 990+ topics, we’ve got you covered! Learn about our mission
Look out for the read-aloud symbol on your next book to see if you can listen to it. The read-aloud tool reads text aloud for you, highlighting the text as it is being read. You can pause it, speed it up and slow it down. Learn more about Read Aloud
Yes! You can use the Perlego app on both iOS and Android devices to read anytime, anywhere — even offline. Perfect for commutes or when you’re on the go.
Please note we cannot support devices running on iOS 13 and Android 7 or earlier. Learn more about using the app
Please note we cannot support devices running on iOS 13 and Android 7 or earlier. Learn more about using the app
Yes, you can access Hyperspectral Remote Sensing by Ruiliang Pu in PDF and/or ePUB format, as well as other popular books in Technology & Engineering & Geology & Earth Sciences. We have over one million books available in our catalogue for you to explore.