- 248 pages
- English
- ePUB (mobile friendly)
- Available on iOS & Android
eBook - ePub
Social Structure In Italy
About this book
This book demonstrates that twentieth century social stratification and the distribution of political and economic power in Italy cannot be properly understood without carefully analyzing the historical dynamics of the development of Italian society. This analysis is also needed to explain the woeful economic, and governmental and administrative performance of the strata that finally reached the levers of power. The Italian society and social and political system are in a crisis: development is uneven and the bureaucratic structures are in shambles. The roots of this crisis lie in the endemic underdevelopment typical of the second half of the nineteenth century. Clearly, they cannot be attributed to the historic failures of Fascism, Democracy, Catholicism or Marxism in Italy, but they are the outcome of a long history of underdevelopment followed by extremely uneven regional evolution leading to tremendous cleavages between ultra-modern and utterly antiquated phenomena, the juxtaposition of flexibility and rigidity, of optimistic enthusiasm and hidebound traditionalism, of extreme wealth and abysmal poverty, of high and low levels of earnings, and of a maladjusted, ill-functioning, uneasy combination of agricultural, industrial, and post-industrial society. All this is aggravated by the crisis in the church and by the North-South situation in which many millions of people have migrated from the South to the North, and by the ensuing struggle between a mass of lumpen proletarians and proletarian immigrants from the South, who are exploited as a work force for the industrial development of the North.
Trusted by 375,005 students
Access to over 1.5 million titles for a fair monthly price.
Study more efficiently using our study tools.
Information
Part One
Vertical and Horizontal Structures in Italian Society
Chapter 1
Theoretical Models of the Structure of Italian Society and the Crisis within it
1 One point at least stands out from the various considerations brought forward by way of introduction: the study of Italian society today must take into account the sort of development that brought it into existence. Any theoretical model or schema used to explain its structures and their transformations presupposes this background of facts. To the extent that Italy has passed from underdevelopment to development, she can be understood in terms of some sort of model of a closed society dialectically related to the model of an advanced industrial society. In practice, however, each region of the country from North to South, from the most industrialized to the most agricultural, has its own place on a continuum between these two extremes, and needs to be seen in terms of its own particular model of transition.
If this is the general picture, our present task is to construct first of all a theoretical model of Italy’s social structure to help us in our efforts to understand it, and then a variety of models designed to account more specifically for such phenomena as the power-system, the value-system, the way in which authority is legitimated, etc. It is not something to be undertaken lightly, since it is all too easy to focus too exclusively on sociological considerations or else to lose one’s way in the labyrinths of ethnology and cultural anthropology. The uneven quality of the developments experienced by Italian society does, in fact, lend itself in some ways to a sociological model and in others to more ethnological models of interpretation. We have opted for a compromise solution to some at least of these problems, viz. two general models and one more specific model set in relationship to each other.
The model we have chosen to represent and explain the structures themselves is mainly socio-economic in character, and we shall deal with this presently, while we have used a dynamically bipolar model of development and underdevelopment to shed light on the cultural shifts in the value-system, the socialization system and the institutional system, and it is against this background that we consider more specific problems and proceed to analyse the dynamics of Italy’s social evolution. At a subsequent point in our investigation we shall also propose another model, dependent on the cultural one, and use it to describe and explain the power-system. First, then, the structural model.
It is clear that we cannot discuss structure unless we attempt to show how the various members of the society we are considering are related both to one another and to the various groups and subgroups of which that society is composed. Hence, our treatment needs to be logical and organic.
For our purposes we see no need to define social structure directly, but we shall indicate some aspects of this notion as it applies to Italian society, and point at the same time to four specific fields of inquiry:
- (a) into Italy’s vertical structure;
- (b) into her horizontal structure;
- (c) into the structures at the top; and
- (d) into her lateral structures.
Without pretending to define structure itself exhaustively, we shall take it here to mean the sum of overall relationships binding together the various parts and members of Italian society on the basis of some definite factors which alone render intelligible these relationships between individuals, infrastructures and sub-systems.
By vertical structure we mean the way in which the population belong or fail to belong to the different productive sectors of Italian society: agricultural, industrial, services, inactive or only marginally active. When we speak of horizontal structure we are referring to the general division of society into different strata, identified principally in terms of their relationship to the means of production and certain other factors to be mentioned later. The structure at the top comprises both those with direct power, such as the political parties and the upper grades in the administration, and those who use their authority to endorse the prevailing value-system: the cultural élite, the Church, etc. Lateral structures are agencies which do not run society directly, or control the means of production wholly or in part, or identify themselves with any value-system or source of authority as such, but which either support the main structure (as the education system does, for instance) or provide for those on its fringe in a way consistent with its overall requirements (e.g., old people’s homes, mental hospitals, prisons, etc.).
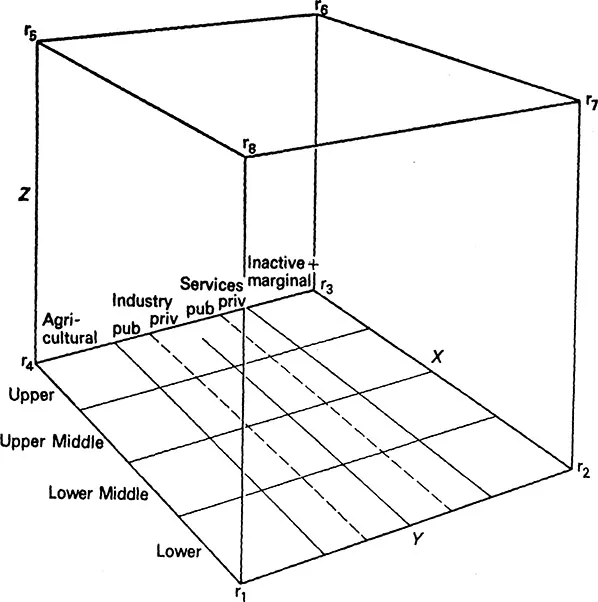
FIG. 1
We shall deal separately with the vertical structure, the horizontal structure and the structure of power at the top, in such detail as our topic seems to require, but any remarks we have to make about lateral structures will occur most naturally alongside the discussion of the other three structures, with which they are so closely interwoven.
How, then, are these three structures themselves interrelated? We can refer to any individual within society by three indices to fix his position within society in terms of vertical membership of a particular productive or non-productive sector, horizontal stratification, and proximity or otherwise to the structure at the top. A diagram will make this clear (see Fig. 1). XY is a plane area in which the line X and those parallel to it represent the sectors within the vertical membership of society (agriculture, industry, services, inactive members) while the line Y and its parallels represent the horizontal stratification of society into the lower, the lower middle, the upper middle and the upper strata. The whole plane XY can then be imagined to rise upwards along the Z axis, which is used to indicate the structure of power at the top. If we consider the public and private sectors of industry and services as separate, there are 24 small squares in the plane XY, which yields 360 small cubes in the cube XYZ, supposing fifteen centres of real or direct power (why this number, we shall explain in chapters 5 and 6) – all of these 360 are real and not just theoretically possible combinations. Of course, such a cuboid classification cannot give any indication of the relative significance of any particular position within it.
Chapter 2
The Vertical Structure
A. Imbalances in the distribution of incomes and the division of labour
2 There is wide agreement as to how gross products and incomes are to be analysed and classified in terms of their distribution among various sectors of society, so that it will not take us long to provide the reader with an overall picture of the vertical structure of Italian society. We shall be summarizing existing conclusions, not arriving at new ones. The important thing is to appreciate the dynamics of this structure in relation to our preceding inquiry into the economic development.
Table 2.1 Gran National Product Distributed Between the Various Sectors of Economic Activity
| Year | Woodlands, Agriculture and Fisheries% | Industry% | Services and Public Administration% | Total GNP |
| | ||||
| 1861–70 | 54.40 | 18.69 | 26.90 | 52,425* |
| 1881–90 | 48.33 | 19.66 | 31.99 | 60,194 |
| 1901–10 | 43.77 | 21.97 | 34.25 | 80,854 |
| 1921–30 | 36.03 | 29.42 | 34.61 | 119,311 |
| 1941–50 | 37.06 | 20.09 | 33.83 | 130,742 |
| 1951–60 | 17.54 | 32.95 | 49.50 | 18,292† |
| 1961–65 | 14.25 | 38.27 | 47.46 | 27,360 |
| 1966–70 | 12.65 | 40.50 | 46.84 | 35,336 |
| 1971 | 11.56 | 40.80 | 47.63 | 39,953 |
| 1972 | 10.65 | 41.06 | 48.28 | 41,240 |
* millions of lire at 1938 rate
† billions of lire at 1963 rate
Take, for instance, the gross national product and its distribution between the economic sectors at different points in time, as shown in table 2.1. The part played by services or tertiary production (excluding the public sector) has been relatively stable, but there has evidently been a steady growth in the industrial sector at the expense of agriculture and forestry,1 so that by 1972 agriculture accounted for only about 10 per cent of the gross national product.2 Moreover, recent developments favour expansion in the tertiary sector at the expense of both industry and agriculture. Since the 1950s the tertiary sector has been about as large as the agricultural and industrial sectors combined, accounting for nearly 50 per cent of GNP.3 Increasing growth continues to occur in both industry and the services at the expense of agriculture, which is only what our study of Italian economic development would have led us to expect.
3 Granted, then, that increasing growth was predictable, we still have to ascertain whether or not the imbalance already noted in the geographical distribution of industrial production at its inception has remained a permanent feature of the overall development.
In fact, development has changed the proportions of the economic relationships between the different sectors, but there has been no change in the basic split between North and South. Consequently, when development first really got under way incomes in some areas were already comparable with those in other advanced European nations, while in others they were below the average for under-developed countries. In some places growth was very slow, in others astonishingly rapid. One example from the South: while incomes in immediately adjacent regions remained stagnant, in the province of Foggia they rose from the equivalent of 159 dollars per inhabitant in 1951 to 342 in 1961 and about 1000 in 1971, with some variation in the calculations of different authorities.
This, too, was only to be expected. When economic growth first got off the ground the imbalance between average individual incomes in the North and in the South was already evident. In terms of population, involvement in agriculture and average earnings for 1950, the dualism between these two Italies just before the economic breakthrough was quite remarkable.4
The split and imbalance between North and South becomes clearer still if we consider the distribution of the labour force between the various sectors in the different regions on the basis of the 1951, 1961 and 1971 census returns.5 The initial situation was hard enough for the South with only 23–24 per cent of the national income, scant possibilities of capital accumulation, and only moderate economic drive. The way in which the sources of wealth were distributed obliged the South to supply 60 per cent of the normal additions to the national labour force during the period of the country’s main economic expansion. Again, in 1951 the gross regional income in the South amounted to little more than one-fifth of the gross national product, although the South accounted for rather more than one-third of the po...
Table of contents
- Cover
- Half Title
- Title
- Copyright
- Contents
- Foreword
- Analytical Summary
- Introduction
- PART ONE: Vertical and Horizontal Structures in Italian Society
- PART TWO: The Pyramid of Power Power – systems and Value-systems
- Conclusions Out of Underdevelopment into Crisis
- Bibliography
- Index
Frequently asked questions
Yes, you can cancel anytime from the Subscription tab in your account settings on the Perlego website. Your subscription will stay active until the end of your current billing period. Learn how to cancel your subscription
No, books cannot be downloaded as external files, such as PDFs, for use outside of Perlego. However, you can download books within the Perlego app for offline reading on mobile or tablet. Learn how to download books offline
Perlego offers two plans: Essential and Complete
- Essential is ideal for learners and professionals who enjoy exploring a wide range of subjects. Access the Essential Library with 800,000+ trusted titles and best-sellers across business, personal growth, and the humanities. Includes unlimited reading time and Standard Read Aloud voice.
- Complete: Perfect for advanced learners and researchers needing full, unrestricted access. Unlock 1.5M+ books across hundreds of subjects, including academic and specialized titles. The Complete Plan also includes advanced features like Premium Read Aloud and Research Assistant.
We are an online textbook subscription service, where you can get access to an entire online library for less than the price of a single book per month. With over 1.5 million books across 990+ topics, we’ve got you covered! Learn about our mission
Look out for the read-aloud symbol on your next book to see if you can listen to it. The read-aloud tool reads text aloud for you, highlighting the text as it is being read. You can pause it, speed it up and slow it down. Learn more about Read Aloud
Yes! You can use the Perlego app on both iOS and Android devices to read anytime, anywhere — even offline. Perfect for commutes or when you’re on the go.
Please note we cannot support devices running on iOS 13 and Android 7 or earlier. Learn more about using the app
Please note we cannot support devices running on iOS 13 and Android 7 or earlier. Learn more about using the app
Yes, you can access Social Structure In Italy by Sabino Acquaviva in PDF and/or ePUB format, as well as other popular books in Politics & International Relations & Politics. We have over 1.5 million books available in our catalogue for you to explore.