eBook - ePub
State Energy Policy
Current Issues, Future Directions
- 307 pages
- English
- ePUB (mobile friendly)
- Available on iOS & Android
eBook - ePub
State Energy Policy
Current Issues, Future Directions
About this book
This book is the product of the good will and hardwork of many people. The contributors, all recognized experts in their fields, are thanked for providing thoughtful, informative chapters and for accommodating editorial suggestions and revisions. Westview Press is thanked for providing the opportunity to address a serious omission in the energy literature. The Geography Department at the University of Maryland made a similarly generous commitment of secretarial staff and faciltiies. Allen Eney aided in the construction of computerized maps. Many skilled, conscientious individuals at state energy offices, public utility commissions, the U.S. Department of Energy, and other organizations supplied essential data and produced many of the analytic studies that underlie the contents of the book. Patti Leedham provided patient and expert typing through numerous revisions of the chapters and many tables. Patricia Sawyer provided essential guidance, support, and proofreading throughout the entire effort.
Trusted by 375,005 students
Access to over 1.5 million titles for a fair monthly price.
Study more efficiently using our study tools.
Information
1
Energy and the States
Stephen W. Sawyer
Energy policy at the state level Is a complex array of topics and figures. This chapter outlines the diverse energy conditions among the states, observes how energy policy has been a long standing activity of the states, discusses recent trends in state energy policy, and the economic concerns that often underlie state energy policy activities. The objective is to both review these topics and to provide a framework for the material presented in subsequent chapters.
Energy Production, Consumption and Expenditure Patterns
In 1984, the U.S. consumed approximately 76.7 quadrillion Btu (quads) of energy and produced a record 68.5 quads. (This includes 73.7 quads consumption and 65.5 quads production officially recorded by the U.S. Dept. of Energy (1985a) and 3 quads of unrecorded renewable energy, principally wood.) Total expenditures for energy in 1984 were approximately $425 billion, roughly 12% of the nation's total GNP. Such energy figures are generally presented on a national basis, masking the fact that nearly all energy in the United States is consumed and purchased, and most of it produced, within individual states. This production and consumption occurs, in turn, in substantially different forms and at greatly different rates and costs among the states. Many factors produce these variations including different state populations, size, and climates, varying energy resource endowments, different social and economic histories, varying fuel costs, and, to a lesser extent, past state policy decisions.
Three fuels account for over 85% of domestic energy production: oil (including natural gas liquids), coal, and natural gas. As illustrated in Figures 1.1, 1.2, 1.3, tremendous variations exist in the production of these fuels. Fully 76% of oil production is concentrated in four states: Texas, Alaska, Louisiana and California. In 40 states, production is either trivial or totally absent. (These include the lowest two categories in Figure 1.1.) Coal production, once concentrated in the Appalachian states, has become more regionally balanced with the increased production in Wyoming, Montana, New Mexico and Texas. Yet, despite this apparent decentralization, three states (Kentucky, West Virginia, and Wyoming) account for 46% of the nation's production. Conversely, in 38 states (the two lowest categories in Figure 1.2) production is, once again, either trivial or totally absent. Natural gas remains the most concentrated of the major fuels with 77% of all production located in just three states: Texas 35%, Louisiana 32%, and Oklahoma 10%.
The western state dominance of energy production evident in the three maps is a recurring theme in state energy policy and the interaction between states. The Pacific Northwest, while deficient in fossil fuel, has unique access to hydropower resources. However, most eastern, non-coal states have only nuclear power and blomass as offsetting resources. The East's scarcity of fossil fuels is one explanation why that region has pursued nuclear power more aggressively than the rest of the nation. (In 1984, nuclear power provided over 20% of the electricity in 12 states east of the Mississippi River and in only three states to the west of it. Over 50% of the electricity was nuclear generated in Maine, South Carolina, and Vermont.)
More than half (56%) of D.S. energy consumption occurs in 11 states. The magnitude of these states' consumption is best illustrated by the fact that if Texas were an independent country it would rank as the seventh largest energy consuming nation in the world; California, the second ranked state in the United States, would be the tenth largest consuming nation. Similarly, the states ranked tenth and eleventh in the United States (Indiana and New Jersey) would rank 21st and 22nd among the independent nations of the world. These 11 states are also notable because it is their consumption levels and policies that most directly influence national consumption rates and achievement of national energy goals. In contrast, the 26 states in the two lowest consumption categories in Figure 1.4 account for just 18% of overall U.S. consumption. The 16 states in the lowest category collectively consume less than California and just 7% of the U.S. total. Population size and industrial location are the leading explanations for the varying consumption levels.
A better measure of the overall energy intensity in each state is provided in Figure 1.5 where total energy consumption is presented on a per capita basis. This map better illustrates the role of energy intensive industry on state consumption levels. The
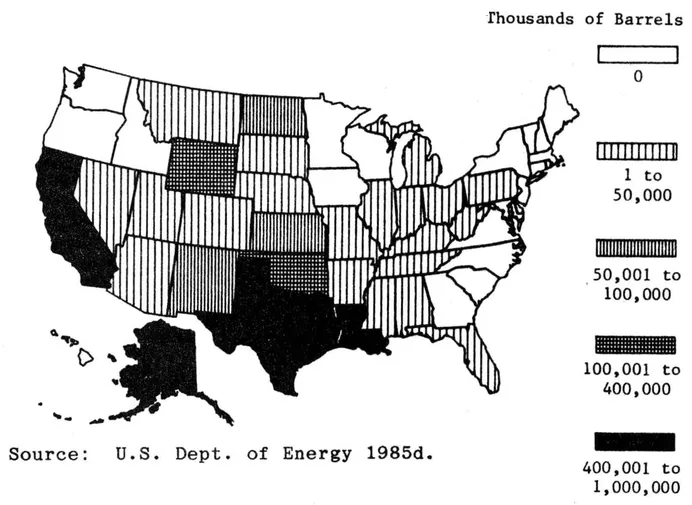
Figure 1.1 Crude oil production in 1984
Source: U.S. Dept. of Energy 1985d.
Source: U.S. Dept. of Energy 1985d.
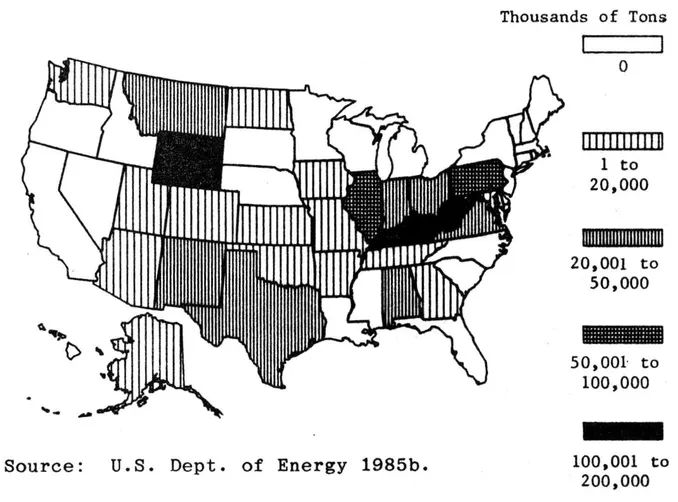
Figure 1.2 Coal production in 1983
Source: U.S. Dept. of Energy 1985b.
Source: U.S. Dept. of Energy 1985b.
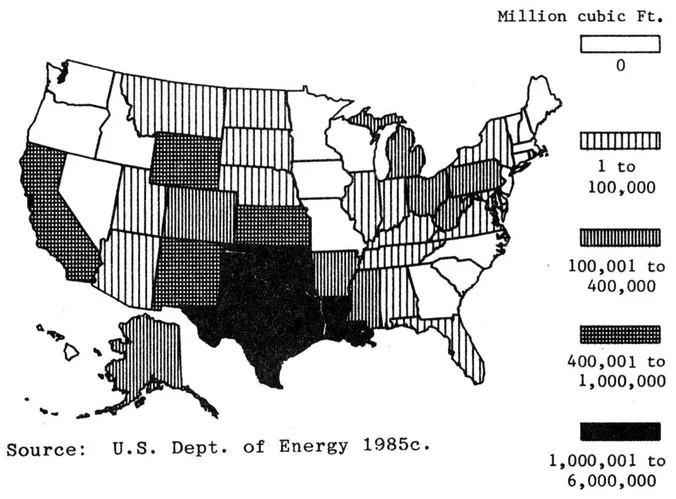
Figure 1.3 Marketed natural gas production in 1983
Source: U.S. Dept. of Energy 1985c.
Source: U.S. Dept. of Energy 1985c.
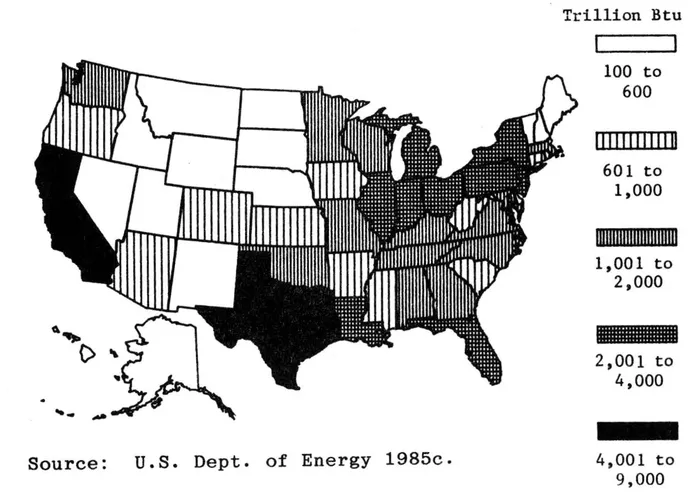
Figure 1.4 Total energy consumption in 1983
Source: U.S. Dept. of Energy 1985c.
Source: U.S. Dept. of Energy 1985c.
high levels among the south central states reflect the presence of petrochemical and other energy intensive industries along the Gulf Coast. Their regional concentration is a direct response to the abundance (and until the mid-1970s, low cost) of oil and natural gas resources of the area. The prominence of Alaska, Wyoming, and several other states generally considered as "non-industrial" illustrates the impact of energy intensive industries (e.g. oil production, mining, and aluminum) on overall state levels. Similarly, the high per capita levels of other rural states reflect large transportation demands and the energy intensity of U.S. agricultural production.
Figure 1.5 is also notable for the pockets of low consumption, particularly in the Northeast. This pattern is a function of historically higher energy prices discouraging energy intensive industries, low transportation demands, and the fact that wood use is not included in the U.S. Dept. of Energy data used to produce the map. Nevertheless, it is important to recognize that the per capita consumption of even the lowest state, Rhode Island, remains large by world standards. It is, for example, approximately 40% greater than the average per capita consumption in Europe.
Important state distinctions are also evident when energy consumption is disaggregated according to fuel type or consumption by sector (residential, commercial, industrial, and transportation). Residential and, to a lesser extent, commercial energy consumption are generally considered the most relevant sectors in state energy policy since states have greater potential to influence their demands than in the industrial and transportation sectors. Moreover, high consumption levels often reflect severe hardship for low income populations. Residential consumption is substantially greater in the Northeast and north central states as a result of colder climates and older housing stock.
Similarly, consumption of certain types of fuel are of particular concern in state energy policy. Despite its current abundance, petroleum is still considered the "high risk" fuel because the decline of O.S. proved reserves is greater than for any other fuel and because of the continued dependence on international sources. As illustrated in Figure 1.6, dependence on petroleum varies considerably among the states. Hawaii, despite attempts to develop its renewable energy resources, remains dependent on oil for over 90% of its energy. Numerous East Coast states are also highly oil dependent. As noted in Figure 1.6, oil accounted for between 60% and 70% of energy consumption in six states in 1981. All of these states have decreased their oil dependence since 1973 and current figures are less than those for 1981. Nevertheless, suggestions for a national oil tax and changes in
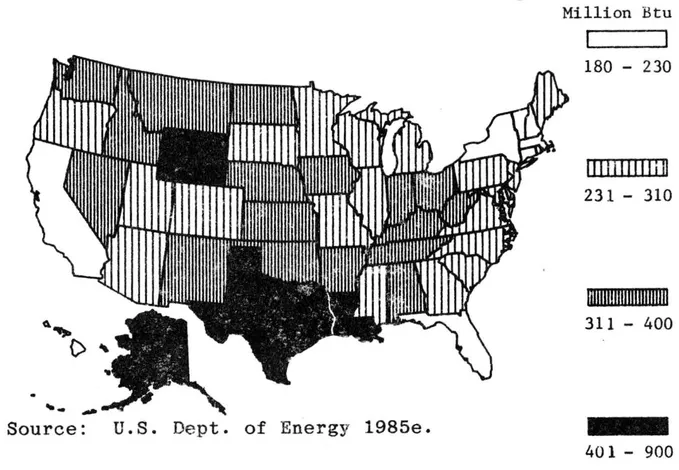
Figure 1.5 Total energy consumption per capita in 1983
Source: U.S. Dept. of Energy 1985e.
Source: U.S. Dept. of Energy 1985e.
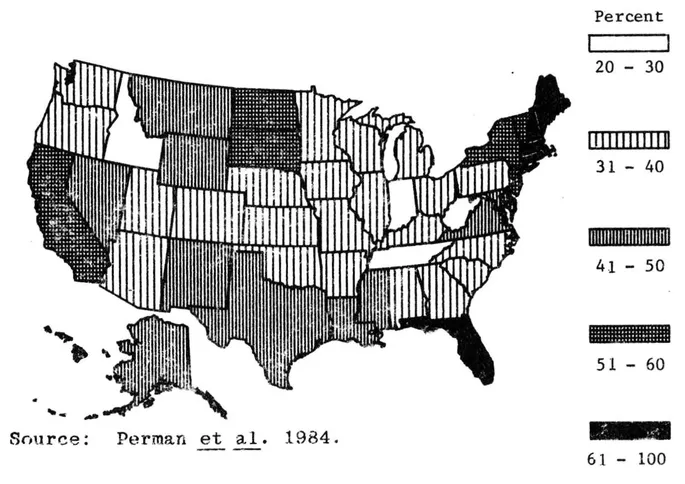
Figure 1.6 Petroleum as a percent of total consumption in 1981
Source: Perman et al. 1984.
Source: Perman et al. 1984.
international oil prices obviously affect these states more than others. At the other extreme, in several coal oriented states oil accounts for less than one third of all energy consumed. These include Ohio, Tennessee, and at just 27%, West Virginia.
These energy consumption patterns are echoed in large dollar expenditures. Despite the leveling or decline of many energy prices, annual expenditures for energy remain alarmingly high. The most recent state level estimates indicate that expenditures in Texas and California were $40 and $39 billion, respectively, in 1982 (U.S. Dept. of Energy 1985f). These expenditure levels are unique; however, expenditures in 10 other states exceeded $10 billion ranging from New York at $26 billion to Georgia at $10 billion, see Figure 1.7. Energy expenditures were estimated to exceed a billion dollars annually in 1982 in every state in the union except Vermont. (Even Vermont would likely have exceeded the billion dollar mark if wood purchases were included.) In each case, expenditures for state energy offices and related state government activities are trifling in comparison.
Nationally, per capita expenditures for all energy averaged $1,810 in 1982 (U.S. Dept. of Energy 1985f). Surprisingly little variation exists when these figures are disaggregated at the state level: per capita expenditures are between $1500 and $2000 in 43 states. The figures do not vary as much as one might anticipate because price and consumption tend to offset one another, i.e. states with higher costs tend to have lower consumption levels. This off setting pattern is particularly evident in industrial consumption. Variations in average household energy expenditures have become less significant than in the 1970s when high oil prices hit the oil importing states, but regulated domestic oil and natural gas kept prices low elsewhere. Still, variations do continue. The Northeast-Midwest Institute estimated that in 1981 household expenditures averaged $1,325 in New England, $1,165 in the Mid-Atlantic states, and $1,037 in the Midwes...
Table of contents
- Cover
- Half Title
- About the Book and Editors
- Title
- Copyright
- Contents
- List of Tables
- List of Figures
- Acknowledgments
- Contributors
- INTRODUCTION
- 1 ENERGY AND THE STATES
- 2 INVENTORY OF CURRENT STATE ENERGY ACTIVITIES
- 3 EVALUATING ENERGY PROGRAMS IN MICHIGAN
- 4 IMPROVING ENERGY EFFICIENCY OF EXISTING HOMES: THE RESIDENTIAL CONSERVATION SERVICE
- 5 SHIFTING WINDS, CHANGING TIDES: NAVIGATING LOW-INCOME CONSERVATION PROGRAMS THROUGH UNCHARTED WATERS
- 6 POLITICS AND POLICY: THE MINNESOTA COMMUNITY ENERGY PROGRAM
- 7 EFFICIENCY STANDARDS IN CALIFORNIA'S ENERGY POLICY
- 8 RENEWABLE ENERGY TAX INCENTIVES: STATUS, EVALUATION ATTEMPTS, CONTINUING ISSUES
- 9 CALIFORNIA'S EXPERIENCE IN PROMOTING RENEWABLE ENERGY DEVELOPMENT
- 10 UNMET ENERGY NEEDS: THE STATES' PERSPECTIVE
- 11 STATE GOVERNMENT'S ROLE IN THE DEVELOPMENT OF ENERGY SERVICE CONTRACTING
- 12 THE ROLE OF PUBLIC UTILITY COMMISSIONS
- 13 STIMULATING INNOVATION THROUGH ALTERNATE INSTITUTIONS
- 14 THE EVOLUTION OF STATE LEVEL ENERGY INSTITUTIONS
- Index
Frequently asked questions
Yes, you can cancel anytime from the Subscription tab in your account settings on the Perlego website. Your subscription will stay active until the end of your current billing period. Learn how to cancel your subscription
No, books cannot be downloaded as external files, such as PDFs, for use outside of Perlego. However, you can download books within the Perlego app for offline reading on mobile or tablet. Learn how to download books offline
Perlego offers two plans: Essential and Complete
- Essential is ideal for learners and professionals who enjoy exploring a wide range of subjects. Access the Essential Library with 800,000+ trusted titles and best-sellers across business, personal growth, and the humanities. Includes unlimited reading time and Standard Read Aloud voice.
- Complete: Perfect for advanced learners and researchers needing full, unrestricted access. Unlock 1.5M+ books across hundreds of subjects, including academic and specialized titles. The Complete Plan also includes advanced features like Premium Read Aloud and Research Assistant.
We are an online textbook subscription service, where you can get access to an entire online library for less than the price of a single book per month. With over 1.5 million books across 990+ topics, we’ve got you covered! Learn about our mission
Look out for the read-aloud symbol on your next book to see if you can listen to it. The read-aloud tool reads text aloud for you, highlighting the text as it is being read. You can pause it, speed it up and slow it down. Learn more about Read Aloud
Yes! You can use the Perlego app on both iOS and Android devices to read anytime, anywhere — even offline. Perfect for commutes or when you’re on the go.
Please note we cannot support devices running on iOS 13 and Android 7 or earlier. Learn more about using the app
Please note we cannot support devices running on iOS 13 and Android 7 or earlier. Learn more about using the app
Yes, you can access State Energy Policy by Stephen W Sawyer,John R Armstrong,Jon M Veigel,Paul F Levy in PDF and/or ePUB format, as well as other popular books in Politics & International Relations & Politics. We have over 1.5 million books available in our catalogue for you to explore.