
- 336 pages
- English
- ePUB (mobile friendly)
- Available on iOS & Android
eBook - ePub
About this book
The flood that affected a third of the United States during the summer of 1993 was the nation's worst, ranking as a once-in-300-years event. It severely tested national, state, and local systems for managing natural resources and for handling emergencies, illuminating both the strengths and weaknesses in existing methods of preparing for and dealing with massive prolonged flooding. Through detailed case studies, this volume diagnoses the social and economic impacts of the disaster, assessing how resource managers, flood forecasters, public institutions, the private sector, and millions of volunteers responded to it. The first comprehensive evaluation of the 1993 flood, this book examines the way in which floods are forecast and monitored, the effectiveness of existing recovery processes, and how the nation manages its floodplains. The volume concludes with recommendations for the future, in hope of better preparing the country for the next flood or other comparable disaster.
Trusted by 375,005 students
Access to over 1.5 million titles for a fair monthly price.
Study more efficiently using our study tools.
Information
Topic
Scienze socialiSubtopic
Sociologia1
Defining the Flood: A Chronology of Key Events
Stanley A. Changnon
Introduction
The Great Flood of 1993 in the Midwest can safely be labeled as "unprecedented" and the creator of record high financial losses. Damage estimates, which climbed from $5 billion to $25 billion during the course of the flood, are now, with more accurate assessments, $18 billion. And it is the damages that qualify the flood of 1993 as the worst on record for the United States (Zimmerman, 1994). The flood affected a third of the United States and severely tested national, state, and local systems for managing natural resources and for handling emergencies, illuminating both the strengths and weaknesses in existing methods of preparing for and dealing with massive prolonged flooding.
Through detailed case studies and sectoral analyses, this volume diagnoses the social and economic impacts of this monumental disaster, assessing how resource managers, flood forecasters, public institutions, the private sector, and millions of volunteers responded to it. This comprehensive evaluation of the 1993 flood examines ways floods are forecasted and monitored, the effectiveness of existing recovery processes, and how the nation manages its floodplains. The flood taught major lessons for addressing future flood disasters, both to the public and private sectors, and these lessons are identified. The emphasis here is on the flood's many impacts and the policy issues that they raise.
This chapter presents an overview of the flood from a physical and policy standpoint, introduces the impact analyses that are central to the book, and then offers a chronicle of the key events before, during, and after the flood. Chapters 2 through 6 describe various physical aspects of the flood, including the effects on the environment, and Chapters 7 through 11 address the social, economic, and policy impacts. Chapter 12 summarizes the myriad physical, socioeconomic, and political impacts of the flood, and Chapter 13 identifies what we have learned from the 1993 flood; those actions that appear to be necessary if the nation and impacted sectors are to more effectively deal with future floods.
Worst Flood Ever?
Some claim that the 1927 flood on the Lower Mississippi River was the worst ever, and others challenge this, claiming the 1993 flood was the worst. The 1927 flood killed many more people (Henry, 1927), but it created less financial loss than the 1993 flood (see Chapter 11). The difference in lives lost (52 in 1993 vs. 313 in 1927) is a reflection of improved flood forecasting and warning systems. The 1993 flood occurred in the Upper Mississippi basin (the area north of Cairo, IL), whereas the 1927 flood occurred in the Lower Mississippi River basin (the area south of Cairo). Both floods led to major federal responses and large expenditures to address restoration of the flooded areas. Remember, the Mississippi River basin is the fifth largest river system in the world and embraces all or portions of 31 of the 48 contiguous states and two Canadian provinces. The 1993 flood ultimately affected 30 percent of this immense area. Figure 1-1 shows where the major flooding occurred.
Debates also continue as to whether the 1993 flood flow in its peak area, St. Louis, MO, ranks second to the massive flood of 1844. Questions over the accuracy of the 1844 measurements of flood flow leave this issue unresolved (Parrett et al., 1993). At some locations, the flood of 1993 ranks as a once-in-100-year event, and at a few others as a once-in-500-year event. Record flooding occurred over 1,800 miles of Midwestern rivers, plus major flooding on another 1,300 miles of rivers (Figure 1-1). In any case, it was a rare and powerful event, a breed apart from other floods.
Defining the 1993 Flood in Space and Time
Pinpointing the beginning and ending of the flood of 1993 is difficult. Some experts would include the spring (April-May) flooding along the Mississippi and Missouri Rivers; others want to confine the Great Flood to the extremes that occurred in June-August; and still others want to include the floods of the fall. Heavy rains across Missouri, Illinois, and Kansas in late September created new flooding on the main rivers and one person drowned. Rains of 3 to 8 inches occurred across southern Illinois and Missouri in mid-November, creating near-instant severe flooding in the Mississippi and its regional tributaries, leading to five deaths. The focus of this book is on the summer flood, a singular geophysical oddity, but attention is given to preceding and ensuing events, which were directly tied to the summer flood.
Defining the flood's spatial dimensions begins with consideration of the summer's 77 large rain areas (each with rains in excess of an inch falling over oblate-shaped areas that were 100 to 200 miles across and 400 to 600 miles long). These rain areas appeared practically every day somewhere in the Midwest during the summer of 1993.
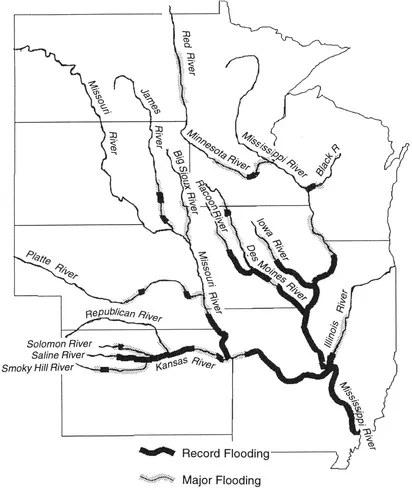
FIGURE 1-1 The reaches of rivers that experienced new record floods and those with nonrecord but major flooding in 1993 (adapted from IFMR Committee, 1994).
Buried within these immense storm systems were at least 175 cores of heavy rain, each producing more than 6 inches of rain in short periods and an untold number of flash floods. These flash floods were an integral part of the flood of 1993 along with the resulting inundation of the floodplains of the major rivers. The extreme wetness in the spring of 1993 continued through the summer and fall with persistent soggy soils and frequent standing water in the flatter upland areas typical of the Midwest. The resulting farm impacts, including delayed crop planting, reduced crop yields, and delayed harvesting, make these wet areas another part of the flood. Thus, the Great Flood included the saturated uplands of the Midwest as well as the flooded streams and rivers and their floodplains, and thus encompassed large portions of nine states. The massive floods on the Mississippi and Missouri Rivers joined at St. Louis (Figure 1-2).
Policy Impacts Extended beyond the Event
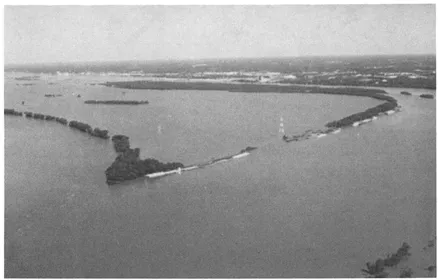
FIGURE 1-2 The confluence of the Missouri River (left) and Mississippi River (right) near St. Louis, MO, at the height of the flood, late July 1993. The large floodplain between them was inundated in floodwaters 10 feet deep, and for the first time in recorded history, major flood peaks came down both rivers simultaneously and joined here on August 1, creating a massive flood surge that swept down the Mississippi towards the Ohio River.
The Great Flood of 1993 created monumental impacts in the Midwest but also became a pivotal event nationally by causing major shifts in government policies relating to flood mitigation, weather risks, and natural hazards. The flood was the culmination of a series of climate anomalies in the United States that began in 1976 when three of four winters set records for severe low temperatures and major storms. The early 1980s were the wettest five years on record, resulting in damaging high levels on the Great Lakes and the Great Salt Lake, but conditions abruptly reversed creating a major drought across the nation during the 1987-1989 period. The 1991-1993 period had been marked by major storms: the High Plains had back-to-back record-high hail losses in 1992 and 1993; Hurricanes Andrew ($30 billion in losses) and Iniki ($5 billion) came in 1992; and the straw that broke the camel's back was the Great Flood of 1993.
The events of these past 18 years proved that our modern society has become ever more sensitive to weather, and in particular to climate aberrations--the prolonged multi-year extremes of weather. Our enhanced vulnerability is tied to many social changes: a growing population at risk, particularly in cities; disaggregated production systems that are highly vulnerable to transportation breakdowns and delays in shipping; an aging infrastructure (highways, drainage and water supply systems, dams, etc.) that is weather sensitive; power utilities facing enhanced economic and regulatory stresses; and ever-enlarging farm sizes, which increase the likelihood of weather losses. Losses from the extremes during the past 18 years also have severely impacted all levels of government, largely through huge relief costs; and the sequence of weather extremes since 1976 culminated in huge costs of the 1993 flood--$6.2 billion from federal coffers and $1 billion from the affected states with 1,000 levees breached (Figure 1-3). The flood finally moved Congress and the Clinton Administration to make fundamental changes in policies and programs involving floodplain insurance, crop insurance, and how the nation handles natural hazards.
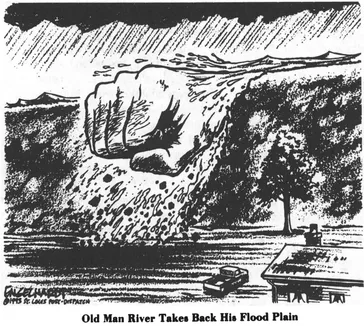
FIGURE 1-3 The enormous impact of the flood and the breaking of over 1,000 levees was a major news topic and became a subject of continuing policy debates (Copyright 1993, Engelhardt, in the St. Louis Post-Dispatch/reprinted with permission).
Defining the Impacts and Responses to the Flood
The primary emphasis of this book is on the impacts that the flood produced. The impacts of a catastrophic event occur in a three-tiered sequence. The first are the direct or initial impacts, such as a measurement that the flooding covered 58 percent of a community's area. The secondary impacts evolve from the direct impacts, such as a ruined water treatment system damaged by chemicals released 50 miles upriver by a flood-caused accident at a chemical plant. The tertiary impacts are those that occur last, usually months or years after the event Examples include the collapse of a structure a year after the flood due to unknown undermining of its foundation, or the loss of a family's income because the employer, a manufacturer, had to close due to the flood damage and/or loss of supplies, or an inability to obtain a loan adequate to restore operations, or eventual loss of a market to another competitor without flood problems. This assessment of the flood made in late 1994 indicates that while many of the impacts have occurred and can be identified and quantified with reasonable accuracy, others can not. Notably, we still lack quantification of the serious environmental impacts. There is also considerable difficulty in obtaining highly accurate estimates of the losses and their costs, including the costs of the responses to the flood. This point is illustrated here to alert and caution the reader about the assessment issues. Probably the best data on the flood's effects have been gathered for the state of Iowa.
Analysis of the flood's economic impact in Iowa illust...
Table of contents
- Cover
- Half Title
- Title
- Dedication
- Copyright
- Contents
- Preface
- Acknowledgments
- About the Contributors
- 1 Defining the Flood: A Chronology of Key Events
- 2 The Weather That Led to the Flood
- 3 A Hydroclimatological Assessment of the Rainfall
- 4 The Flood's Hydrology
- 5 Physical Effects: A Changed Landscape
- 6 Ecosystem Effects: Positive and Negative Outcomes
- 7 Impacts on Agricultural Production: Huge Financial Losses Lead to New Policies
- 8 Impacts on Transportation Systems: Stalled Barges, Blocked Railroads, and Closed Highways
- 9 Economic Impacts: Lost Income, Ripple Effects
- 10 Living with the Flood: Human and Governmental Responses to Real and Symbolic Risk
- 11 Effects of the Flood on National Policy: Some Achievements, Major Challenges Remain
- 12 Losers and Winners: A Summary of the Flood's Impacts
- 13 The Lessons from the Flood
- About the Book
Frequently asked questions
Yes, you can cancel anytime from the Subscription tab in your account settings on the Perlego website. Your subscription will stay active until the end of your current billing period. Learn how to cancel your subscription
No, books cannot be downloaded as external files, such as PDFs, for use outside of Perlego. However, you can download books within the Perlego app for offline reading on mobile or tablet. Learn how to download books offline
Perlego offers two plans: Essential and Complete
- Essential is ideal for learners and professionals who enjoy exploring a wide range of subjects. Access the Essential Library with 800,000+ trusted titles and best-sellers across business, personal growth, and the humanities. Includes unlimited reading time and Standard Read Aloud voice.
- Complete: Perfect for advanced learners and researchers needing full, unrestricted access. Unlock 1.5M+ books across hundreds of subjects, including academic and specialized titles. The Complete Plan also includes advanced features like Premium Read Aloud and Research Assistant.
We are an online textbook subscription service, where you can get access to an entire online library for less than the price of a single book per month. With over 1.5 million books across 990+ topics, we’ve got you covered! Learn about our mission
Look out for the read-aloud symbol on your next book to see if you can listen to it. The read-aloud tool reads text aloud for you, highlighting the text as it is being read. You can pause it, speed it up and slow it down. Learn more about Read Aloud
Yes! You can use the Perlego app on both iOS and Android devices to read anytime, anywhere — even offline. Perfect for commutes or when you’re on the go.
Please note we cannot support devices running on iOS 13 and Android 7 or earlier. Learn more about using the app
Please note we cannot support devices running on iOS 13 and Android 7 or earlier. Learn more about using the app
Yes, you can access The Great Flood Of 1993 by Stanley Changnon in PDF and/or ePUB format, as well as other popular books in Scienze sociali & Sociologia. We have over 1.5 million books available in our catalogue for you to explore.