![]()
1
Introduction to the Achievement Gap and the Literacy Gaps Model
We have a state of emergency in the educational system of the United States. This state of emergency relates to the under-achievement of English Language Learners (ELLs) and Standard English Learners (SELs) and the growing gap between ELLs/SELs and their native English-speaking peers. In a country that purports to stand for freedom, education for all, and social justice, this state of emergency educationally and morally mandates that teacher training institutions, teachers, schools, districts, parents, and communities come together to solve this crisis. This book, The Literacy Gaps: Bridge-Building Strategies for English Language Learners and Standard English Learners, attempts to do just that. By presenting data regarding the historic and present crisis, we will provide the research-based rationale for a new teaching model that will assist teachers in bridging the gap between ELLs/SELs and the text (readability issues), ELLs/SELs and their teachers (perceptions and expectations), and
English Language Learners (ELLs) are “students whose primary language is not English and whose English language skills are not sufficient to allow them to function fully in academic English” (U.S. Department of Education, 2000).
ELLs/SELs and their peers (differentiation strategies). The Literacy Gaps Model will also have the ability to integrate familiar research-based teaching practices into a coherent, holistic model that can strengthen the framework around which teachers conceptualize effective practices that enable ELLs/SELs to access academic language, literacy, and ultimately success within the American educational system, thereby providing a springboard from which students may enter into mainstream society as educated, productive citizens who will lead the next generation.
This introductory chapter verifies the achievement gap between mainstream and nonmainstream students in the United States, including immigration patterns and specific linguistic and cultural data, detailing recent and historic research. First, we introduce (1) demographic patterns, (2) languages spoken and socioeconomic factors, (3) ELL achievement, and (4) findings from the National Literacy Panel. Second, we will introduce the concept of the Standard English Learner and an emerging body of research that demonstrates specialized linguistic needs. Finally, we will introduce the Literacy Gaps Model around which the book is written, presenting a model that will assist teachers across the United States in bridging the achievement gap of their English Language Learners and Standard English Learners.
Standard English Learners (SELs) are students who grew up speaking variations of Standard English, such as African American Vernacular English (AAVE), Chicano English, or Hawaiian English.
DEMOGRAPHIC PATTERNS
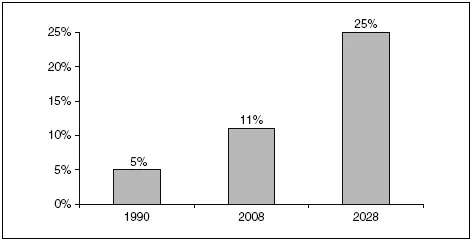
In this section, the analysis of data by Goldenberg (2008) presents a strong foundation for the urgency of meeting the needs of ELLs in today’s classrooms. In the past 15 years, the number of students who do not speak English fluently has grown dramatically. Whereas in 1990, an estimated 1 in 20 public school students in grades K–12 was an English Language Learner, today the figure is 1 in 9, virtually a 50% increase. Similarly, the estimate is that in 20 years the figure will be 1 in 4, which will represent yet another 50% increase.
Figure 1.1 represents the dramatic ELL growth over the past 18 years, as well as the continued demographic forecast for this subgroup. It further demonstrates that the issue of closing the literacy and achievement gap is not a temporary need, and that the number of ELLs in U.S. schools will only continue to grow in the next 20 years (Goldenberg, 2008).
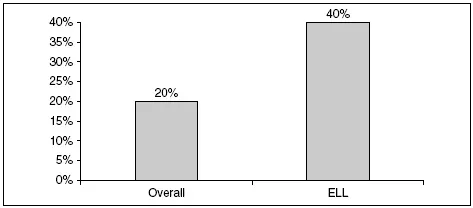
In addition, whereas the overall population increased by 20% since 1990, the ELL population grew from 2 million to 5 million in the same time period, representing a 40% increase (Goldenberg, 2008; National Clearinghouse for English Language Acquisition [NCELA], 2006, 2008).
Figure 1.1 K—12 ELL Growth
SOURCE: Goldenberg, 2008.
Figure 1.2 represents the 20% increase in overall population in contrast to the 40% increase in ELLs during the same time period. The dramatic increase of this subgroup compared to the general population has created instructional gaps in meeting the specific needs of these learners. Even states that typically have not had to contend with the needs of ELLs, such as Indiana, South Carolina, and Tennessee, all saw an increase of approximately 300% in their ELL population from 1994-1995 and 2004-2005 (Goldenberg, 2008; NCELA, 2008).
Figure 1.2 Percentage of ELL and Overall Population Growth
SOURCE: Goldenberg, 2008; NCELA, 2006, 2008.
LANGUAGE SPOKEN AND SOCIOECONOMIC FACTORS
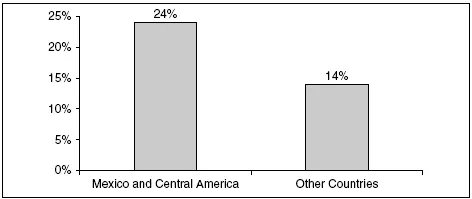
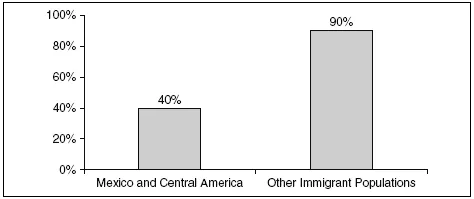
In addition, 80% of ELLs in the United States come from Spanish-speaking homes and the majority of ELLs are Spanish speakers. This group generally comes from lower socioeconomic and educational backgrounds as compared to the general population or other immigrant groups. Whereas 24% of immigrants from Mexico and Central America are below the poverty level (see Figure 1.3), only 9-14% of immigrants from other regions of the world are below the poverty level (Goldenberg, 2008; Larsen, 2004).
Figure 1.3 Poverty Level Percentages
SOURCE: Goldenberg, 2008; Larsen, 2004.
Whereas fewer than 40% of immigrants from Mexico and Central America came to the United States with the equivalent of high school diplomas, 80-90% of immigrants from other countries came with at least a high school diploma (Goldenberg, 2008). Such statistics suggest that ELLs from Mexico and Central America often come to school with less English and more socioeconomic barriers, facing more challenge and adjustments than other immigrants. For example, socioeconomic gaps can create misunderstandings between educators and parents when immigrant parents are not as visible in school because they work multiple jobs in order to provide for their families. Educators can misinterpret parental absence as apathy. Instead, educators must find additional ways to meet the needs of students and families who are merely trying to economically survive in the United States, creating bridges, rather than barriers, in the educational process.
Figure 1.4 represents the fact that immigrants from other countries are more than twice as likely to have graduated from high school as those from Mexico and Central America. Both poverty and education levels become important as they present potential risk factors for students in school. In essence, ELLs from Mexico and Central America have to overcome additional challenges that can interrupt education or present additional challenges in school. As classroom teachers, it is imperative that we understand the distinctive needs that each group of ELLs comes to school with so that we can target instruction and meet needs appropriately.
Figure 1.4 Percentage of High School Diplomas
SOURCE: Goldenberg, 2008; Larsen, 2004.
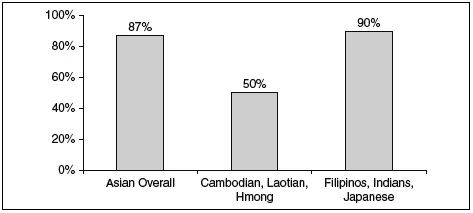
The second-largest group of ELLs in the United States—about 8% of all ELLs—is speakers of Asian languages, including Vietnamese, Hmong, Chinese, Korean, Khmer, Laotian, Hindi, and Tagalog (Goldenberg, 2008; Larsen, 2004). As a subgroup, these students tend to come from higher socioeconomic and educational backgrounds than do other immigrant populations. Socioeconomically, Asian immigrants represent the second-lowest poverty rate, 11.1%, with over 87% having the equivalent of a high school diploma (Goldenberg, 2008; U.S. Census Bureau, 2008). There is, of course, variation among speakers of Asian countries. (See Figure 1.5.) Compared to 87% of Asian immigrants overall who have the equivalent of a high school diploma, only 50% or fewer Cambodian, Laotian, and Hmong adults in the United States have completed high school. In addition, Filipinos, East Indians, and Japanese in the United States have high school completion rates around 90%, while over 60% of Taiwanese and East Indian immigrants have college degrees (Goldenberg, 2008; U.S. Census Bureau, 2008).
Figure 1.5 High School Graduation Rates for Asian Immigrants
SOURCE: Goldenberg, 2008; U.S. Census Bureau, 2008.
Data suggest that we must not assume that all Asian immigrants come to the United States with the same set of skills and socioeconomic background. In other words, this is not a monolithic group. Group tendencies as well as individual differences must be considered. Schools with large groups of ELLs from Southeast Asia may have some of the same educational gaps as schools with ELLs from Mexico or Central America, and may benefit from some of the same instructional accommodations. However, when an ELL comes from a home where parents are educated and literate, there can be instructional acceleration of social language in order to more quickly address academic language needs.
ELL ACHIEVEMENT
Achievement data suggest that ELLs lag far behind their native English-speaking peers. Nationwide, only 7% of ELLs scored “at or above proficient” in reading on the 2003 fourth-grade National Assessment of Educational Progress (NAEP), as compared to about 30% of students overall. Results on the 2007 NAEP were similar, with only 7.5% of fourth-grade ELLs scoring at least “proficient,” while 35.5% of native English speakers scored proficient (Goldenberg, 2008).
Figure 1.6 illustrates not only the gap between ELLs and their native English-speaking peers, but also the fact that ELL achievement has only progressed slightly—less than half a percentage point—while native English learners have progressed by 5.5% over the 4-year period (Goldenberg, 2008). Certainly for an ELL, any assessment becomes an English proficiency assessment of language when these students are in the process of learning language; therefore, educators and educational leaders and systems must become knowledgeable in meeting the needs of this growing ELL population so as to close the gap, not increase it, over time.
The achievement gap between ELLs and native English learners is not just an individual teacher or school issue but is also a systemic issue—one that most states and the nation as a whole must address with fervor. With Title III of the No Child Left Behind (NCLB) Act, districts are held accountable for ELLs’ progress in English Language Development...