In the best science classrooms, teachers see learning through the eyes of their students, and students view themselves as explorers. But with so many instructional approaches to choose from—inquiry, laboratory, project-based learning, discovery learning—which is most effective for student success?
In Visible Learning for Science, the authors reveal that it's not which strategy, but when, and plot a vital K-12 framework for choosing the right approach at the right time, depending on where students are within the three phases of learning: surface, deep, and transfer.
Synthesizing state-of-the-art science instruction and assessment with over fifteen years of John Hattie's cornerstone educational research, this framework for maximum learning spans the range of topics in the life and physical sciences. Employing classroom examples from all grade levels, the authors empower teachers to plan, develop, and implement high-impact instruction for each phase of the learning cycle:
Surface learning: when, through precise approaches, students explore science concepts and skills that give way to a deeper exploration of scientific inquiry.
Deep learning: when students engage with data and evidence to uncover relationships between concepts—students think metacognitively, and use knowledge to plan, investigate, and articulate generalizations about scientific connections.
Transfer learning: when students apply knowledge of scientific principles, processes, and relationships to novel contexts, and are able to discern and innovate to solve complex problems.
Visible Learning for Science opens the door to maximum-impact science teaching, so that students demonstrate more than a year's worth of learning for a year spent in school.
eBook - ePub
Visible Learning for Science, Grades K-12
What Works Best to Optimize Student Learning
- 216 pages
- English
- ePUB (mobile friendly)
- Available on iOS & Android
eBook - ePub
Visible Learning for Science, Grades K-12
What Works Best to Optimize Student Learning
About this book
Trusted by 375,005 students
Access to over 1.5 million titles for a fair monthly price.
Study more efficiently using our study tools.
Information
1 Science Learning Made Visible
Space junk. The Pacific Ocean garbage patch. Climate change. Endangered species. Water. The future of our species is largely in the hands of science, engineering, and technology. The solutions to these crises, and many more, will be solved by scientists who have the cognitive flexibility required to think differently about scientific phenomena and how the world works as a result of these phenomena. To some extent, these three fields have contributed to the very problems that they must now solve. Consider the race to space. Space programs are the crown jewels of industrialized countries, representing a sense of pride and accomplishment. Who would have thought that the Sputnik and Apollo missions, and the race to communicate worldwide, would eventually result in more than 500,000 pieces of debris orbiting Earth, all traveling at speeds up to 17,500 miles per hour (Garcia, 2016)? These unintended consequences, or side effects, now provide the very questions that current and future scientists and engineers must answer. We could easily explore each of these major issues facing Earth and the millions of species that inhabit the planet, but that’s not the point of this book. Rather, the point is that the world needs scientists of all types who demonstrate the cognitive flexibility necessary for tackling the questions, challenges, and crises of the 21st century and beyond. Schools have the responsibility to educate scientists who can collaborate, solve problems, and innovate.
The essential question is this: What is the best way to educate future scientists? And of equal importance: How do we educate members of society so that they understand science, even if they are not going to become scientists themselves? An understanding of science and the processes associated with doing science are not exclusively set aside for those who aspire to be biologists, chemists, geoscientists, or physicists. Scientific literacy, or the knowledge and understanding of the scientific concepts and processes necessary for active engagement in society, is essential for all of us to make informed decisions in our personal lives and when participating in civic, cultural, and economic affairs. Having some understanding of science is part of being an informed citizen. Thus, we really have a dual purpose for this book. We hope to contribute to the conversation about the education of future scientists, especially the types of learning experiences that will prepare them to generate new ideas and solve problems. But we also hope to ensure that the students who graduate from our schools and do not intend to pursue a career in science understand the biological, physical, and social world around them. We want them to be able to think critically about the claims that are made in the media, popular culture, and scientific publications designed for the general public. Take the debate about vitamin C. As Huang and Franzus (1984) note, “the vitamin C debate started at the moment of the discovery of vitamin C” (p. 19). To this day, there are debates about the role of this vitamin in treating a wide range of human conditions, from the common cold to cancer. There is general scientific agreement about the vitamin’s role in preventing scurvy, but not in treating other conditions. How does the average person negotiate the conflicting information found on the Internet? How does that person make an informed decision about his or her own personal life? Without a strong grounding in science, neither the future scientist nor the average member of society will be well served by the information from any source.
Much like the vitamin C debate, the world of education has been somewhat adrift and at risk for wide swings across the proverbial pendulum as one study seems to recommend a specific strategy and the next study recommends the exact opposite. For example, in the world of science education, there remains a debate about direct instruction versus inquiry-based approaches. In Dean and Kuhn’s words (2007), “Findings revealed that direct instruction seems to be neither a necessary nor sufficient condition for robust acquisition or for maintenance over time” (p. 384). But then Zepeda, Richley, Ronevich, and Nokes-Malach (2015) demonstrated the value of direct instruction in metacognitive skills such as planning, monitoring, and evaluation. As they say, “direct instruction and practice of multiple metacognitive skills can improve metacognitive monitoring, learning, transfer, and motivational outcomes in middle school science class” (p. 966). Who do you believe? What actions do you take to improve students’ learning? It seems that there are no clear answers to what works best for students to learn science—which is frustrating, to say the least.
Visible Learning
Enter visible learning. The Visible Learning database is composed of more than 1,400 meta-analyses, with more than 80,000 studies and 300 million students (Hattie, 2009, 2012). That’s big data when it comes to education. In fact, some have claimed it’s the largest educational research database amassed to date. To make sense of so much data, John (Hattie) focused his work on synthesizing meta-analyses. A meta-analysis is a statistical tool for combining findings from different studies with the goal of identifying patterns that can inform the collective work of teachers and leaders. In other words, meta-analyses are studies of studies. Consider the use of homework and the influence on student learning. On any given day, administrators and teachers could easily find a study that suggests that homework has a positive influence on student learning. Then the next day, they could find a study that presents an opposite finding. What’s a teacher to do? A synthesis of meta-analyses analyzes the collective findings from the studies on homework to unpack the overall trends in these findings. In other words, what does the combined research say, in this case, about homework?
However, the story behind the findings is not solely based on whether findings were positive, were negative, or had no influence on learning. The magnitude of the influence matters as well. The tool that is used to aggregate the information from these combined studies is an effect size. An effect size (ES) is the magnitude, or size, of a given effect. Effect size information helps readers understand the impact in more measurable terms. For example, imagine a study in which teaching students science while having them sit on barstools resulted in statistically significant findings (p < 0.01, for example). People might remodel all science classrooms to include barstools, and stock in companies that sell these stools to schools would soar. It might even become common and accepted educational practice for all science classrooms to be stocked with barstools.
But then, suppose, upon deeper reading, you learn that the barstools had a 0.03-month gain over the control group, an effect size pretty close to zero. You also learn that the sample size was very large, and the results were statistically significant because of this large sample size, even though the impact was not very valuable. Would you still limit seating in science to barstools? Probably not (and we made up this example, anyway). The takeaway message is that this approach to research helps administrators and teachers make better decisions in their schools and classrooms by focusing on both the impact and the magnitude of that impact.
Understanding the effect size lets us know how powerful a given influence is in changing achievement—or, said another way, the return on investment for a particular approach. Some things are hard to implement in our schools and classrooms and have very little impact. Other things are easy to implement and still have limited impact. To have the biggest impact on student learning in science, we search for things that have a greater impact, some of which will be harder to implement and some of which will be easier to implement. When you’re deciding what to implement to impact students’ science learning, wouldn’t you like to know what the effect size is? Knowing the effect size would allow you to decide whether a particular influence, strategy, or action is worth the effort. But what is the threshold for “worth it” and “not worth it”? John (Hattie) was able to demonstrate that influences, strategies, actions, and so on with an effect size greater than 0.40 allow students to learn at an appropriate rate, meaning at least a year’s growth for a year in school. Before this level was established, teachers and researchers did not have a way to determine an acceptable threshold, and thus weak practices, often based on studies that were statistically significant, continued. In other words, teachers and researchers advocated for practices that showed a positive and statistically significant relationship with learning but did not equate to a year of growth for a year in school. Let’s take two real examples.
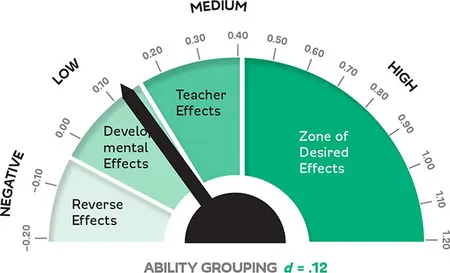
First, let’s consider ability grouping. There have been countless numbers of conversations in schools about the best ways to staff classes. To help people understand effect sizes, John (Hattie) created a barometer so that information could be presented visually. The barometer for ability grouping can be found in Figure 1.1. As you can see, the effect size is 0.12, well below the zone of desired effects of 0.40. This is based on 14 meta-analyses, with 500 studies that examined 1,369 effects. Although it’s appealing to want to group students by their ability as it is perceived by adults, the evidence suggests that there are more effective ways for impacting students’ learning.
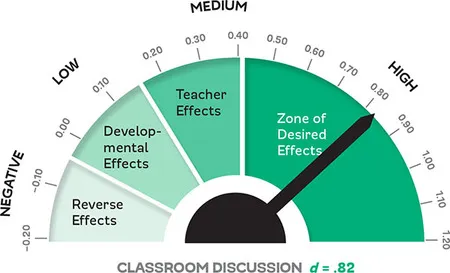
Second, let’s consider increasing classroom discourse (which is synonymous with classroom discussion or dialogue). Students would be invited to talk with their peers in collaborative groups, working to solve complex and rich tasks. The students would not be grouped by ability, but rather would be grouped by the teacher intentionally to ensure that there is academic diversity in each group as well as language support and varying degrees of interest and motivation. As can be seen in the barometer in Figure 1.2, the effect size of classroom dialogue, or what we prefer to call discourse, is 0.82, well above our threshold, and likely to result in 2 years of learning gains for 1 year of schooling. This finding is generated from 42 studies that examined 42 effect sizes. As a teacher, you would be wise to focus your energy on building classroom discourse rather than focusing on grouping students by ability.
The Visible Learning database has been useful in determining what works best. A lot of things work. But only some things increase the likelihood that students learn a year’s worth of content and thinking skills for a year’s worth of schooling. You see, 95% of the things that teachers do work when researchers and educators assume that there will be zero growth. Only a few things work at ensuring that students gain a full year’s worth of growth for a year of enrollment in school. And we think it’s time that educators focus on what works best, what doesn’t work, and what can’t hurt. To answer our own questions: What is the best way to educate future scientists, and how do we educate members of society so that they understand science, even if they are not going to become scientists themselves? To accomplish this, we must design learning experiences that implement what works best in the teaching and learning of science. However, this implementation requires that these learning experiences be designed with purpose and intention, driven by where learners start out in their learning and where they need to go next in their learning.
Figure 1.1 Barometer 1: Effect Size of Ability Grouping
Surface, Deep, and Transfer
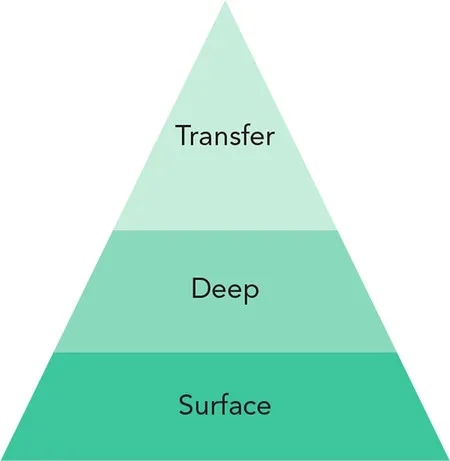
The risk of the visible learning list of effect sizes is that administrators and teachers will take a top-10 approach and focus exclusively on those influences within that ranking. We don’t support this approach because the list does not focus on phases of students’ learning. These approaches, strategies, and influences work differentially, based on where students are in their thinking. We think of three levels, or phases, of learning: surface, deep, and transfer (see Figure 1.3). Students must develop surface-level learning if they are ever going to go deep. And with the right instructional moves, deep learning can facilitate transfer.
Figure 1.2 Barometer 2: Effect Size of Classroom Discussion
Learning is a process, not an event. Students understand some science content only at the surface level. As we note in the next chapter, surface learning is often not valued, but it should be and needs to be an essential component of every science classroom. You have to know something about a scientific idea or concept to be able to do something with that idea or concept. We’ve never met a student who could synthesize information from multiple sources who didn’t have an understanding of each of the texts. It’s important to note that we do not define surface-level learning as superficial learning. Rather, we define this phase of the learning as the initial development of conceptual understanding, process skills, and vocabulary of a new science topic.
Video 1.1 Visible Learning Defined

http://resources.corwin.com/vl-science
Figure 1.3 Three Levels of Learning: Surface, Deep, and Transfer
With appropriate inst...
Table of contents
- Cover
- Half Title
- Title Page
- Copyright Page
- Contents
- List of Videos
- Acknowledgments
- About the Authors
- Introduction
- 1 Science Learning Made Visible
- 2 Science Surface Learning Made Visible
- 3 Science Deep Learning Made Visible
- 4 Science Transfer Learning Made Visible
- 5 Science Learning Made Visible Through Evaluation
- References
- Index
- Publisher Note
Frequently asked questions
Yes, you can cancel anytime from the Subscription tab in your account settings on the Perlego website. Your subscription will stay active until the end of your current billing period. Learn how to cancel your subscription
No, books cannot be downloaded as external files, such as PDFs, for use outside of Perlego. However, you can download books within the Perlego app for offline reading on mobile or tablet. Learn how to download books offline
Perlego offers two plans: Essential and Complete
- Essential is ideal for learners and professionals who enjoy exploring a wide range of subjects. Access the Essential Library with 800,000+ trusted titles and best-sellers across business, personal growth, and the humanities. Includes unlimited reading time and Standard Read Aloud voice.
- Complete: Perfect for advanced learners and researchers needing full, unrestricted access. Unlock 1.5M+ books across hundreds of subjects, including academic and specialized titles. The Complete Plan also includes advanced features like Premium Read Aloud and Research Assistant.
We are an online textbook subscription service, where you can get access to an entire online library for less than the price of a single book per month. With over 1.5 million books across 990+ topics, we’ve got you covered! Learn about our mission
Look out for the read-aloud symbol on your next book to see if you can listen to it. The read-aloud tool reads text aloud for you, highlighting the text as it is being read. You can pause it, speed it up and slow it down. Learn more about Read Aloud
Yes! You can use the Perlego app on both iOS and Android devices to read anytime, anywhere — even offline. Perfect for commutes or when you’re on the go.
Please note we cannot support devices running on iOS 13 and Android 7 or earlier. Learn more about using the app
Please note we cannot support devices running on iOS 13 and Android 7 or earlier. Learn more about using the app
Yes, you can access Visible Learning for Science, Grades K-12 by John Almarode,Douglas Fisher,Nancy Frey,John Hattie in PDF and/or ePUB format, as well as other popular books in Education & Teaching Science & Technology. We have over 1.5 million books available in our catalogue for you to explore.