![]()
1
KNOW YOUR AUDIENCE
SUBHASHISH SAMADDAR AND SATISH NARGUNDKAR
Georgia State University
Contents
Preparing for Your Presentation
Organizing the Presentation
Audience Interaction
I (Subhashish Samaddar) was scheduled to make an hour-long presentation to the senior management of a client company regarding the optimization of retirement benefits to be paid out to their employees. This was a project I had been working on for about a year with this client. My recommendation based on detailed financial impact analysis had to do with whether to maintain the status quo or to implement a new multilayered postretirement benefits package. Immediately prior to the meeting, I had lunch with several members of senior management from the client company, including the Senior Vice President (SVP) of Human Resources, who was ultimately responsible for the decision. As the lunch was coming to a close, and I was about to start my presentation, an employee walked up to the SVP and whispered something in his ear. There was a pause in the room, and I could sense from the SVP’s body language that something was wrong. Confirming my suspicion, he walked over to me and said,
I need to take care of an emergency situation and leave within a few minutes. Would you like to reschedule your presentation for another day or give me the highlights of your analysis and recommendation right now? I can give you about five minutes.
Not wanting to leave things hanging and uncertain, I opted to speak to him right then. I had just a few seconds to distill the entire presentation down to my key recommendation and the most compelling arguments to support it. I got it done in four minutes. He smiled, looked at his second-in-command, and said,
“I like it. I am in. Why don’t you continue and let me know what you think.” He then left the room in a hurry.
The rest of the meeting lasted only about 15 minutes. All of my recommendations were accepted for implementation.
On the way back home that day, I realized that I got lucky. I was able in this instance to do what I did on the fly, but that may not always work. I made a note to myself that in the future, I would always be prepared with a 3–5-minute summary of any presentation that I planned to give, and make sure it was compelling enough to seal the deal. I have learned that shortening the presentation down to its most essential elements takes significant thought and preparation. The good news is that we often know what is necessary to sell our ideas. The bad news is that we know a whole lot more about the problem and its analysis and are eager to share all of that wealth of knowledge with any audience, assuming that they need it. The question to ask oneself is, “Is it really necessary to say all this to this particular audience to achieve my objective?” Over the years, I have developed a rule to help me be more succinct. I simply ask myself the question, “Would I still include this sentence in the presentation if it cost me $1,000 to do so?”
Most well-known speakers in history have in some form expressed the idea that it takes more effort to make a speech short and effective. A famous quote, variously attributed to Woodrow Wilson, Winston Churchill, and others, goes something like this—“If I am to speak ten minutes, I need a week for preparation; if an hour, I am ready now.” Make sure you spend that “week” to prepare.
Preparing for Your Presentation
During an analytics project, you (the analyst) generally will make more than one presentation, during various phases of the project, to different stakeholders. To prepare for an effective presentation to senior management, the first thing one needs to do is to define the objective clearly. What are you trying to achieve? How will you know if your presentation was a successful one? The more specific you can make the objective in your own mind, the more likely you are to achieve it. For most analytics professionals, the objective of a presentation tends to be to convince management that the analysis meaningfully addresses a business problem, and to make recommendations for action, along with compelling evidence that makes it likely to get their buy-in.
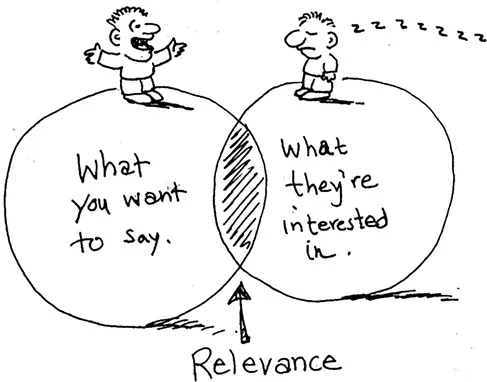
Once the objective is clear, the next step is to understand the audience. Who will be present? What are their objectives? What are their expectations coming in to this meeting? What is their professional or academic background? Members of senior management are generally highly intelligent and capable. They are well informed about their business and are generally well educated, though not necessarily in analytics or related quantitative fields. Be careful not to underestimate someone because they do not have your technical background. They are generally busy and impatient with details. They have a wider view of the organization and are engaged in making many high-stakes decisions. The problem addressed by your analysis is likely to be just one of them. The challenge for you is to present your technical analysis and recommendations in a way that is accessible and relevant to your audience.
Source: http://rankmaniac2012-caltech.blogspot.com/
It is worthwhile to use all the channels available to you to find out what you can about your audience prior to designing the presentation. Aside from their objectives and who they are, it can help to find out their preference in processing information. For instance, some may be more comfortable with charts and figures, while others may prefer a presentation without any visual aids (some managers have a “no PowerPoint” rule). It helps to discover any special capabilities, preferences, or needs of your audience. For instance, some managers that are technically savvy may want to explore the data/models you present to test assumptions or explore scenarios. In such cases, it might be necessary to be prepared to have a demonstration ready on some software that they can use to work along with you. An example of a special need could be audience members that are color blind. This will impact your choice of visuals. Knowing the risk tolerance of the audience can also affect the recommendations that you present. Entrepreneurs and angel investors may be more risk tolerant than top management of an established organization.
Organizing the Presentation
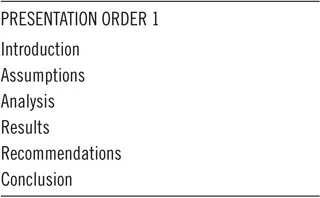
The first task in organizing your presentation is to decide the order in which to tell the story. The typical approach used by many analysts is the chronological sequence, beginning with an introduction, data and assumptions, the analytical methodology used, the results, and to finish, the recommendations and conclusion (Table 1.1).
This sequence is ingrained in our minds, perhaps for a couple of reasons. One, most college project or research presentations and academic papers follow this structure. Also, this is the sequence in which the work is done, so it seems logical to present it that way. An academic audience may appreciate this sequencing, since in the academic world, it is critical to show the development of the thought process behind the work done and to demonstrate that the methodology used is appropriate. The result itself is not paramount. The opposite is often true in the business world. The business client is primarily interested in results, not in how your mind works or the process you went through to get there. This is not to imply that using the appropriate methodology is unimportant in business. The point is that if you have been entrusted with the task and are assumed to be competent at it, therefore, you know the right methods to use. The methodological details do not need to be presented unless asked for. While buying a custom computer desk, we are interested in the features and best use of the finished product, not in what tools and processes the carpenter used to build it.
Table 1.1 Traditional Presentation Sequence
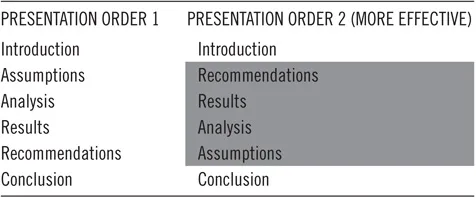
Table 1.2 More Effective Presentation Sequence
In our experience, a more effective sequence for presentations to senior management is to get straight to the business recommendations after the introduction, justify them with the results of your analysis, and discuss the methodology only if asked (Table 1.2). However, always be prepared for that contingency. It is useful to have a separate presentation handy in case someone is interested in the complexities of the techniques, algorithms, data, or process used.
You can experiment with variations of this theme depending on the context and your audience. For instance, you may find it useful to discuss the assumptions first, and then go to the recommendations. Alternately, would it be more beneficial to show the results before making recommendations? While we found the sequence shown above to be generally the most effective, the key is to be flexible enough to design the presentation based on your objectives and your understanding of your audience.
Audience Interaction
The discussion above deals with what you do before the presentation. Now let’s discuss the presentation itself. A while ago, about 15 minutes into an hour-long presentation to a client, I noticed that some of the senior audience members had stopped listening to me. They were animatedly talking to each other and pointing to the screen, ignoring my presence. My first reaction was to think that I had made some mistake. However, noticing from their body language that they seemed to have obtained some key insight from that particular slide, I remained silent, waiting for them to turn their attention back to me. I resisted the temptation to intervene and ask them if they had any questions about what I had said. In a short while, one of them turned to me and said with a smile “now we know the answer to our problem.” I was a bit surprised, and before I could say anything, he said, “Unless you have something else to present, we are done. Can we break for lunch now?” I was happy to end the presentation right there and go to lunch with them 40 minutes early! The audience’s broader knowledge of their organization complemented my presentation and helped them get an insight from my chart that I could not have delivered. The lesson I learned was that one cannot always fully anticipate how the audience will react to something. Paying attention to the audience’s body language and remaining flexible was the key. However, that is difficult to do without first being at ease with oneself and one’s presentation.
In the situation mentioned above, I briefly lost the audience for what turned out to be a positive reason. That is of course not always the case. In a different presentation, I noticed negative body language from a senior analyst in the audience, who I knew had a master’s degree in statistics. Recognizing that he may have had a concern that he was not voicing, I stopped and asked him if he had a question or comment. It turned out that he did have a technical concern and strongly disagreed with me. I was able to resolve the situation to his satisfaction and win him over to my way of thinking by going into some technical details that I would otherwise not have presented. It was important, however, that I was prepared for such a contingency. Needless to say, a complete grasp of the technical aspects of what you are presenting goes a long way in making an effective presentation.
It is good practice to spend some time thinking through your presentation beforehand and anticipating possible questions or challenges. When possible, preempt potential questions by building the answers into your presentation. Additionally, be cognizant of the human side to presentations. Humility, a sense of humor, and simply being comfortable in conversations with people can be a big asset in achieving your objectives in any presentation.
![]()
2
PRESENTING RESULTS FROM COMMONLY USED MODELING TECHNIQUES
SUBHASHISH SAMADDAR AND SATISH NARGUNDKAR
Georgia State University
Contents
Regression Analysis
Cluster Analysis
Summary
As an analytics professional, one may use a wide variety of mathematical techniques. Each of these techniques has its own mathematical algorithm, and the output is often filled with obscure details that are valuable to the analyst, but a distraction to a managerial audience. Distilling the key insights from the output and presenting them in the language of business rather than that of mathematics is crucia...