eBook - ePub
Visible Numbers
Essays on the History of Statistical Graphics
- 330 pages
- English
- ePUB (mobile friendly)
- Available on iOS & Android
eBook - ePub
About this book
Bringing together scholars from around the world, this collection examines many of the historical developments in making data visible through charts, graphs, thematic maps, and now interactive displays. Today, we are used to seeing data portrayed in a dizzying array of graphic forms. Virtually any quantified knowledge, from social and physical science to engineering and medicine, as well as business, government, or personal activity, has been visualized. Yet the methods of making data visible are relatively new innovations, most stemming from eighteenth- and nineteenth-century innovations that arose as a logical response to a growing desire to quantify everything-from science, economics, and industry to population, health, and crime. Innovators such as Playfair, Alexander von Humboldt, Heinrich Berghaus, John Snow, Florence Nightingale, Francis Galton, and Charles Minard began to develop graphical methods to make data and their relations more visible. In the twentieth century, data design became both increasingly specialized within new and existing disciplines-science, engineering, social science, and medicine-and at the same time became further democratized, with new forms that make statistical, business, and government data more accessible to the public. At the close of the twentieth century and the beginning of the twenty-first, an explosion in interactive digital data design has exponentially increased our access to data. The contributors analyze this fascinating history through a variety of critical approaches, including visual rhetoric, visual culture, genre theory, and fully contextualized historical scholarship.
Trusted by 375,005 students
Access to over 1.5 million titles for a fair monthly price.
Study more efficiently using our study tools.
Information
Topic
ArtSubtopic
History of ArtPART I
Visualizing Bodies:
Health, Disease, Evolution
In the nineteenth century a new and profound method for displaying data appeared: graphical displays that visualized people—their population, ethnicity, health, occupations, living conditions, physical characteristics, and a host of other criteria. Graphical innovators began charting these measurements in a variety of forms—thematic maps, bar graphs, wind roses, mosaics, illustrations—both to tell compelling “stories,” as Tufte puts it (Envisioning 37, 108), about human beings and human behavior and to solve problems through visual exploration.
This part of Visible Numbers focuses primarily on the exploratory nature of data design in transforming health and science relating to the body. Particularly in the nineteenth century, data design became a valuable tool for defining and addressing compelling health problems and for arguing for improvements in health policy and medical treatment. Celebrated visualizations like John Snow’s London cholera map and Florence Nightingale’s rose charts on the casualties of the Crimean War have already received much-deserved attention, but much of the story of the burgeoning interest in visualizing health data remains to be told. In their chapter on smallpox, Candice Welhausen and Rebecca Burnett examine how visual displays, beginning in the seventeenth century, incrementally helped scientists, doctors, and public health officials to eradicate one of the deadliest diseases in history and one of the earliest to be charted. Welhausen and Burnett scrutinize those advances in public health in their social, cultural, and intellectual context, as data about smallpox outbreaks and experimental techniques for reducing risk were gradually made visible.
In her chapter on table design and forms, Lee Brasseur also examines the role of visualizing data in improving public health. Brasseur shows how Florence Nightingale designed and implemented tabular charting techniques that revolutionized the documentation of hospital patients, enabling medical professionals to analyze, compare, and identify patterns in the data and adapt treatments accordingly. Like many pioneers, Nightingale initially encountered resistance to her charting methods, but her innovation prevailed because it worked, dramatically improving the delivery of British health care.
In the second half of the nineteenth century, the theory of evolution transformed the scientific and intellectual landscape, fostering an interest in visualization techniques that illustrated the new paradigm. In his chapter, Alan Gross examines how visualizations of animal anatomy helped develop the discipline of geometric morphometrics, which plots evolutionary changes in the shape (e.g., bone structure) of mammals and reptiles. This process of precisely charting species’ physical characteristics continued to unfold for nearly a century, most recently with 3-D digital modeling.
Chapter 1
Visualizing Evolution and Development: The Rise of Geometric Morphometrics
So here and elsewhere an apparently infinite variety of form is defined by mathematical laws and theorems, and limited by the properties of space and number. And the whole matter is a running commentary on the cardinal fact that, under such foedera Naturai [laws of nature] as Lucretius recognised of old, there are things which are possible, and things which are impossible, even to Nature itself.D’Arcy Thompson1
Although humans and Neanderthals share a common ancestor, they differ in skull formation. In Neanderthals, the rear of the cranium is characterized by a bun-shaped protrusion, the brows are heavy, the forehead slopes, and no chin is evident. Insofar as these differences are structural, they concern anatomy; insofar as they are functional, physiology. Changes in structure and function, however, also entail changes in shape, patterns of change beyond the disciplinary scope of anatomy, or physiology. Until the second decade of the twentieth century, there was no inkling of a science whose task was this subject, the shape of living things as they develop and evolve; until the last half-century, no science existed adequate to the precise analysis of changes in shape incident on development and evolution. In short, there was no geometric morphometrics, no happy combination of the mathematical and the visual. That at each stage this evolving science needed to be depicted as well as described gives me my subject, an analysis designed to deepen our understanding of scientific visuals as their practitioners struggle to live within, to exploit, and eventually to overcome the limitations of the printed page.
I begin my story in the second decade of the last century with D’Arcy Thompson, the first to intuit that evolution and development could be depicted by a fusion of the visual and the mathematical. This fusion he depicted in the form of vivid distortions in Cartesian grids. His idea was, however, an intuition only; because of the limitations of these grids, he was unable to turn his insight into a mathematically sound science of shape. Our story continues in the 1930s, a decade in which two separate attempts were made to create a science of shape. Both failed, though for very different reasons. Julian Huxley rightly insisted that in determining changes in shape real measurements only be employed. But his mathematics fell far short of his ambition. He continued to graph changes in individual features, not realizing that these could not be isolated from the suite of which they were a part. Karl Pearson and G.M. Morant were more successful at their task. For the first time, to fix spatial relationships, they plotted landmarks onto shapes, realizing that only then could mathematical comparisons legitimately be made. Still, they failed to create a science, for two reasons: they lacked a true mathematical theory of shape, and they were forced by the limitations of the printed page to misrepresent a three-dimensional science in two dimensions. Nonetheless, theirs was a significant advance, one that lacked influence simply because it appeared in a specialist publication and seemed, in any case, to focus only on a minor historical puzzle concerning the identity of the Wilkinson Head. But Pearson and Morant managed to turn that puzzle into a major exploration of the basis required to create a science of shape that fuses the mathematical and the visual. Thus their work forms a bridge from Thompson and Huxley, from a morphemics that is potentially a quantitative science, to one that is fully.
Finally, I come to Fred Bookstein, F. James Rohlf, and their followers; I come to the present and to a true science, a quantitative endeavor that measures evolutionary and developmental changes in shape, employing to do so landmarks anchored firmly in three-dimensional mathematical space. This new science appears in two new visual forms: on the page, thin-plate splines, a far more sophisticated version of D’Arcy Thompson’s grids, one that takes exact measurement into consideration. And more significantly, on the Internet, it appears in three-dimensional mathematical reconstructions, a visual apotheosis so vivid that it is easy to forget the wholly theoretical and mathematical origin of these images.
D’Arcy Thompson: Morphology Meets Geometry
There is no disagreement among the generations of his followers that the science of shape was inaugurated by D’Arcy Thompson in On Growth and Form, a book so important that it remains in print and is cited to this day, nearly a century after its first publication. This credit does not deny predecessors: Georges Cuvier is a brilliant and well-known example. But in a chapter virtually unaltered from the book’s first to its final edition, Thompson provided one visual demonstration after another that dramatized the formidable power of geometry when applied to the changing shapes of growing and evolving creatures. Perhaps the most famous of his images—reproduced in Huxley and in Bookstein—superimposes a Cartesian grid on the shapes of two fish related by evolution, Didion and Orthagoriscus mola (Huxley 105; Bookstein, The Measurement 69). In Thompson’s representation of Didion and Orthagoriscus, the vertical coordinates of Didion have become for Orthagoriscus a system of concentric circles, the horizontal coordinates a system of curves (see Figure 1.1). This transformation allows us to see evolution in geometrical terms.
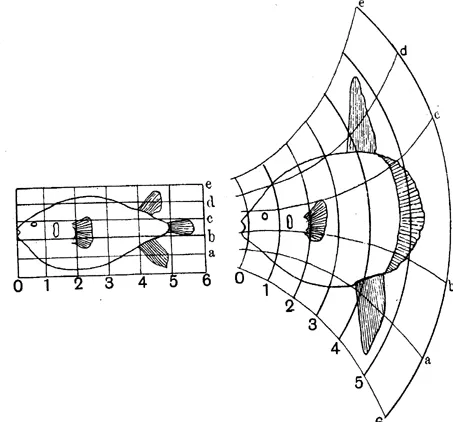
Figure 1.1 A Cartesian grid applied successively between Didion and Orthagoriscus mola
Source: Thompson, 1917, p. 751.
In his text, Thompson emphasized a crucial point about these images: development and evolution must be represented as integrated networks of change. For example, contemplating the differences in the shape of skulls of humans, chimpanzees, and baboons, Thompson noted “it becomes at once manifest that the modifications of jaws, brain-case, and the regions between are all portions of one continuous and integral process” (771). It is a process of progressive change analogous to the distortion of fossils under the influence of geophysical forces: “a simple and homogeneous transformation, such as would result from the application of some not very complicated stress” (761).
Thompson also applied these principles to evolutionary change. In Figure 1.2, reading from bottom to top, we see on the left conjectural reconstructions in the evolutionary tree of the horse; on the right we see the already discovered fossil heads of these horses. While in general the extent of agreement is remarkable, there is one case where it is not, Pa, Parahippus. But from this difference between Pa and its contrasting conjectural image D, Thompson does not draw the conclusion that his method has shortcomings. Rather, “though some writers have placed Parahippus in the direct line of descent between Equus and Eohippus, we see at once that there is no place for it there, and that it must, accordingly, represent a somewhat divergent branch or offshoot of Equidae” (Thompson 768). This conjecture has since been verified. Further emboldened, Thompson considered human ancestry. He found that as a consequence of his method there can be no common line of descent between Homo sapiens and Neaderthals: rather “among human and anthropoid types, recent and extinct, we have to do with a complex problem of divergent, rather than of continuous, variation” (Thompson 772). This conjecture has since been verified.
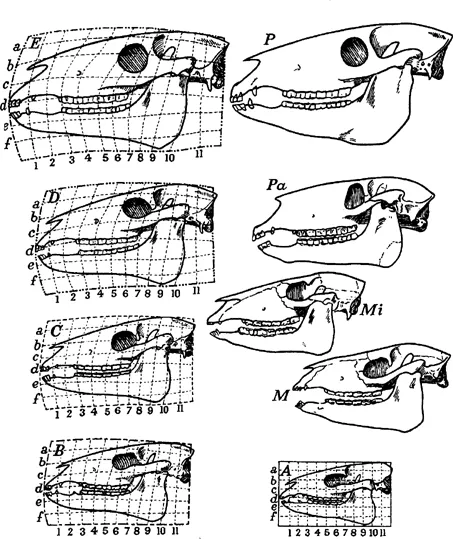
Figure 1.2 Conjectural fossil horse’s heads in grids compared with actual fossils
Source: Thompson, 767.
Thompson was well aware of some of the limitations of his method. First, it was not easily quantifiable. He pointed to:
the simple fact that the developing organism is very far from being homogeneous and isotropic, or, in other words, does not behave like a perfect fluid. But though under such circumstances our co-ordinate systems may no longer be capable of strict mathematical analysis, they will still indicate graphically the relation of the new co-ordinate system to the old. (736)
He recognized further that even this result depends on the presence of a pattern of landmarks, a pattern of biologically significant locations he could not reliably supply, those that fix the degree of change over time. Even so, Thompson seriously underestimated the height of the barrier to the next logical step in his research program, the analytical unwieldiness that results when the method of coordinates is applied to actual measurements of networks of growth. It is this difficulty that a pair of images from Sokol and Sneath dramatize. It is clear from Figure 1.3 that the cat genus Dasyurus is incommensurable with the possum genus Phalanger (see also Bookstein, The Measurement 77). Thompson’s simple geometric transformations simply cannot bridge the gap. His images inspired future generations of scientists by posing a problem in the form of a solution, a solution that required a mathematics far more sophisticated than he could muster.
Julian Huxley: Quantifying Morphology
Huxley’s 1932 Problems of Relative Growth acknowledged the ground-breaking work of Thompson: “the coordinate method” is “of the utmost importance as affording a graphic and immediate proof of the need for postulating regularities in the distribution of growth throughout the body” (106).2 Moreover, Huxley concurred that the recognition of his own innovation, growth gradient patterns proceeding from centers of growth, is “implicit in his [Thompson’s] Cartesian transformations” (“Appendix” 292). Nevertheless, Huxley felt, Thompson’s methods were undermined by a defect so serious that a new beginning is necessary, on...
Table of contents
- Cover
- Half Title
- Title Page
- Copyright Page
- Table of Contents
- List of Figures
- List of Tables
- Dedication
- Acknowledgments
- Notes on Contributors
- Introduction
- Part I Visualizing Bodies: Health, Disease, Evolution
- Part II Visualizing Nations: Morality, War, Nationalism
- Part III Examining Visible Numbers: Forms, Methods, Historiographies
- Works Cited
- Index
Frequently asked questions
Yes, you can cancel anytime from the Subscription tab in your account settings on the Perlego website. Your subscription will stay active until the end of your current billing period. Learn how to cancel your subscription
No, books cannot be downloaded as external files, such as PDFs, for use outside of Perlego. However, you can download books within the Perlego app for offline reading on mobile or tablet. Learn how to download books offline
Perlego offers two plans: Essential and Complete
- Essential is ideal for learners and professionals who enjoy exploring a wide range of subjects. Access the Essential Library with 800,000+ trusted titles and best-sellers across business, personal growth, and the humanities. Includes unlimited reading time and Standard Read Aloud voice.
- Complete: Perfect for advanced learners and researchers needing full, unrestricted access. Unlock 1.5M+ books across hundreds of subjects, including academic and specialized titles. The Complete Plan also includes advanced features like Premium Read Aloud and Research Assistant.
We are an online textbook subscription service, where you can get access to an entire online library for less than the price of a single book per month. With over 1.5 million books across 990+ topics, we’ve got you covered! Learn about our mission
Look out for the read-aloud symbol on your next book to see if you can listen to it. The read-aloud tool reads text aloud for you, highlighting the text as it is being read. You can pause it, speed it up and slow it down. Learn more about Read Aloud
Yes! You can use the Perlego app on both iOS and Android devices to read anytime, anywhere — even offline. Perfect for commutes or when you’re on the go.
Please note we cannot support devices running on iOS 13 and Android 7 or earlier. Learn more about using the app
Please note we cannot support devices running on iOS 13 and Android 7 or earlier. Learn more about using the app
Yes, you can access Visible Numbers by Miles A. Kimball,Charles Kostelnick in PDF and/or ePUB format, as well as other popular books in Art & History of Art. We have over 1.5 million books available in our catalogue for you to explore.