- 416 pages
- English
- ePUB (mobile friendly)
- Available on iOS & Android
eBook - ePub
About this book
Low cost carriers (LCCs) represent one of the most exciting and dynamic yet often contentious developments in recent commercial aviation history. Formed as a direct result of policies of airline deregulation and liberalisation that were initiated in the United States in the late 1970s before being implemented in certain European, Australasian, Latin American and other world markets from the mid-1990s onwards to encourage competition, LCCs have been responsible for progressively reconfiguring the spatial patterns, operational practices and passenger experiences of flight. In the process, they have enabled growing numbers of people to fly to more places, more frequently, and at lower cost than had been previously possible. In so doing, however, they have generated a number of socio-economic and environmental challenges. The 23 essays included in this volume provide a detailed insight into the emergence, expansion and evolution of the low cost carrier sector worldwide. The volume covers deregulation and liberalisation of the global airline sector, the business models and operating characteristics of low cost carriers, the changing nature of the airline/airport relationship, LCC network characteristics, issues of pricing and competition and the current impacts and likely future trajectories.
Trusted by 375,005 students
Access to over 1.5 million titles for a fair monthly price.
Study more efficiently using our study tools.
Information
Part I
Deregulation and Liberalization
[1]
The Evolution of U.S. Airline Competition
Studies by academic economists were a significant force in the movement towards deregulation of the domestic airline industry in the early 1970s (Levine, 1965; Jordan, 1970; Keeler, 1972; Douglas and Miller, 1974). During the critical 1977-78 period in which deregulation was imposed first de facto by the Civil Aeronautics Board (CAB) and then de jure by Congress, the chairman and vice-chairman of the CAB were economists. For the 14 years since deregulation, economists have continued intensive study of the industry, in part because of the unusual availability of reliable firm- and transaction-level data and in part because of the rare opportunity to observe an industry as it evolves from strict economic regulation to fairly unimpeded competition and strategic behavior.
The simplest prediction of economists about airline deregulation, and one of the few on which nearly all economists agreed, was that deregulation would improve consumer welfare in comparison to continued price and entry regulation. Fourteen years later, nearly all economists still agree on this, though the degree of enthusiasm for the deregulation outcome varies considerably. There was substantial disagreement among economists about the market structure that would result. Because studies of scale economies in the airline industry had concluded that none existed beyond the scale of the smaller major airlines of the 1970s (Caves, 1962; Eads et al., 1969), many economists argued that deregulation would result in more than the 11 major airlines that existed at the time of deregulation. Others predicted that only a few, or possibly only one, airline would survive at a large scale. Two noted University of Chicago economists, Sam Peltzman and Lester Telser, made a bet in 1979 on whether the 4-firm concentration ratio would be above or below 90 percent by 1985. Peltzman bet that it would be below 90 percent and, as he put it, “won the bet, but lost the war.” Nationwide, concentration decreased during the first few years following deregulation, but has turned upward since then.
Though comparisons of the airline industry under regulation and deregulation continue, this is not my primary focus here.1 As the time since deregulation grows, such comparisons to the “straw man” of regulation are increasingly speculative and decreasingly relevant to the issues at hand. Regulation under the CAB was far from ideal; if it were reimposed today, it would probably be more efficient than the pre-1978 regulation. Deregulation has also entailed missteps that would not be repeated were the process to be replayed. Therefore, an estimate of the net welfare gain (or loss) resulting from deregulation gives little guidance about the relevant choices that will face policy-makers in the future.
For the most part, the lessons that have been learned from the deregulated domestic airline industry are not about government regulation or the process of deregulation, but about the tactics, strategies, and results of competition in a dynamic, complex, and innovative service industry. These lessons are more likely to inform economists about the market process in, for instance, the hotel or fast-food industries than in electric power distribution or other traditional areas of regulation.
The next section reviews the evolution of the domestic airline industry since the late 1970s, when it was abruptly freed from most regulatory constraints on pricing, entry and exit. (International air travel is considered here only as it relates to competition in the domestic industry. This is due both to space limitations and because international air travel remains heavily and idiosyncratically regulated.2) The following sections will examine the competitive issues that have arisen since deregulation; the conclusions, and in some cases consensus, that economists have reached on these issues; and the public policy options in dealing with the airline industry in light of these issues.
A Brief History of the Deregulated Airline Industry
In the early 1970s, just a few years prior to deregulation, government intervention in the airline industry reached its apex. The CAB had prevented entry of new start-up airlines for many years, but in the early ’70s it also imposed a “route moratorium,” ceasing to assign new authority for existing airlines to serve new city-pairs and preventing many airlines from abandoning routes that they no longer wished to serve. At the same time, the CAB decided that the discounts with which it had experimented in the ’60s—such as student fares and discounts for a spouse accompanying a full-fare passenger— conflicted with its mandate for fair and equitable prices, so it greatly reduced the scope for such fares.
Table 1
Measures of Domestic Airline Industry Concentration Since Deregulation
Measures of Domestic Airline Industry Concentration Since Deregulation
1977 | 1982 | 1987 | 1990 | |
4-firm Concentration Ratio | 56.2% | 54.2% | 64.8 % | 61.5% |
8-firm Concentration Ratio | 81.1% | 80.4% | 86.5% | 90.5% |
Herfindahl Index | 0.106 | 0.093 | 0.123 | 0.121 |
Source: U.S.D.O.T. Air Carrier Traffic Statistics, Revenue Passenger-Miles.
Note: The 4- and 8-firm concentration ratios are the sums of the market shares of the 4 and 8 largest firms, respectively. The Herfindahl index, the sum of the squared market shares of all firms, ranges between 0 and 1.
By 1976, however, the CAB began to move towards deregulation by again permitting discriminatory fare discounts. In the following two years, the Board permitted free entry of any certified carrier on a few selected routes, breaking with its history of choosing which airlines would compete in each market. It also relaxed the restrictions on chartered service to the extent that charters became close substitutes for regular scheduled flights. Just as some of the major airlines had begun to sue the CAB for violating its congressional mandate by allowing too much competition, Congress passed the Airline Deregulation Act of 1978. The Act set out a time schedule for relaxation of price and entry regulation and permitted the CAB to accelerate that schedule as it deemed appropriate.
New entry boomed and prices fell substantially on most routes, especially long distance routes. On the shorter routes, which had been cross-subsidized under regulation, real prices did not fall as much and even increased in some cases. Airline profits were at record levels in 1978, but the 1979 oil price shock dampened these gains. As the deep recession of the early 1980s set in, the profits turned to large losses. Entry of new airlines slowed markedly and came to a nearly complete halt by 1983. In the next few years, many of the new entrants and the pre-deregulation smaller carriers either merged with a major carrier or declared bankruptcy and ceased operations. Table 1 presents the evolution of three different measures of nationwide concentration in the industry. By all three measures, concentration increased between 1982 and 1990, and is now higher than it was in 1977. Figure 1 tracks the lineage of the major carriers that operated in 1991.
Figure 1
Chronology of Large U.S. Airlines Since Deregulation
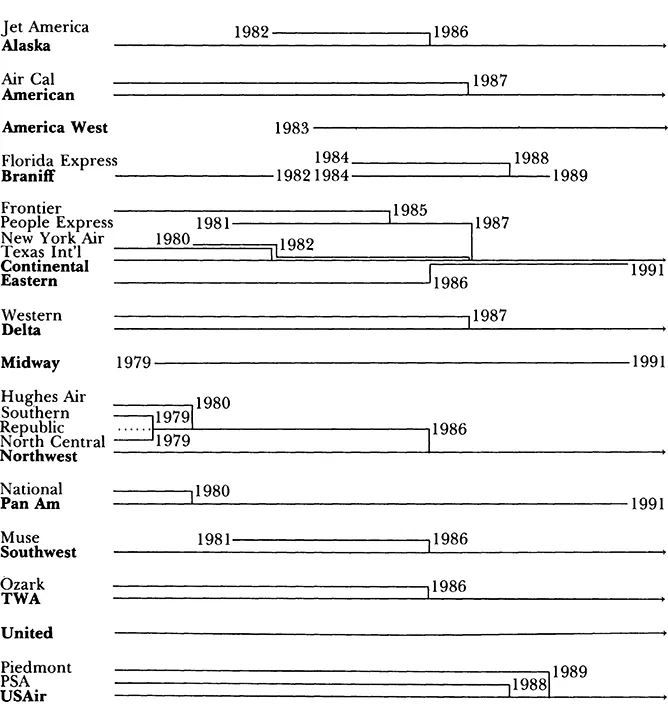
Source: Kaplan (1986) and Wall Street Journal, various issues
Measures of national concentration are convenient reference points, but the increase in concentration is less apparent at the city-pair route level, where competitors’ products are effective substitutes for one another. Table 2 shows that looking at all traffic, route level concentration decreased substantially between 1984 and 1987, and showed a slight drop between 1987 and 1990. If we examine direct trips, however—those in which the passenger does not change planes—concentration has steadily increased from 1984 to 1990.
This outcome reflects the growth of hub-and-spoke operations. All major airlines now have one or more hubs at which many of their long-distance passengers change planes. This approach has allowed carriers to fill a higher proportion of the seats on their planes and to increase flight frequency of nonstop routes between their hubs and other airports. Since most hub airports can accommodate large-scale operations of only one airline, both logistically and economically, competition has tended to decrease on direct routes to and from the hubs. Yet, because a hub allows an airline to serve a large number of routes with a change of plane at the hub, longer routes and ones on which most passengers change planes are now served by many airlines, each channeling passengers through its particular hub airport. This explains the decline in concentration on longer routes and increase on shorter routes—usually served without a change of plane—when all trips are examined.
Table 2
Average City-Pair Herfindahl Indexes
Average City-Pair Herfindahl Indexes
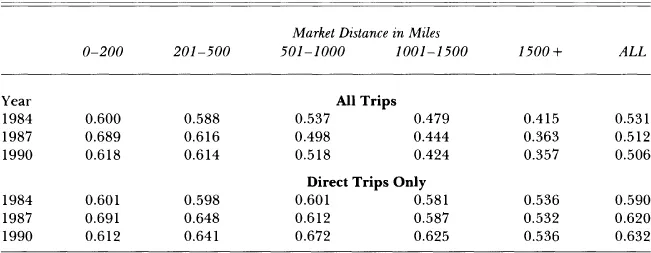
Source: U.S.D.O.T. Databank 1A.
Note: Excludes interline tickets and markets with less than 10 passengers per day. The numbers shown are unweighted averages across routes. The sign and approximate magnitudes of these changes are the same if routes are weighted by either passengers or passenger-miles. All data are for the second quarter of the given year.
One drawback to hub-and-spoke operations is that a larger proportion of passengers change planes, especially on longer trips, instead of flying nonstop from their origin to their destination. The share of trips over 1500 miles that involve a flight change rose from 42 percent in 1978 to 52 percent in 1990. On trips between 500 and 1500 miles, it increased from 33 percent in 1978 to 38 percent in 1990. Gordon (1992) finds that nonstop service has increased on most of the top 500 routes since deregulation, but even on these higher density routes, the increase in nonstop flights has not kept pace with the increase in traffic. Furthermore, the loss of nonstop service is more likely to be evident on smaller routes.
Still, by allowing each airline to serve more city-pairs with change-of-plane service, hub systems have decreased the proportion of passengers who need to change airlines as well as planes during their trip. Carlton, Landes, and Posner (1980) and many passenger surveys have concluded that changing airlines imposes substantial additional costs on passengers, due to increased probability of missed connections and lost baggage. The proportion of trips that included a change of airline fell from 11.2 percent in 1978 to 6.9 percent in 1981, 4.0 percent in 1984, and 1.2 percent in 1987 and 1990. While the more recent changes are due in substantial part to mergers among major carriers, the earlier and more significant declines are explained largely by formation of hub-and-spoke systems.
Furthermore, for most travel between non-hub airports, the choice of departure times has been enhanced substantially by hub-and-spoke operations. A thinly traveled route that had one or two nonstops a day under regulation is likely now to have 10 or more possible change-of-plane routings through different hubs spread throughout the day. Finally, hub-and-spoke operations have contributed to the increased use of satellite airports such as Oakland, Burbank, or Orange County in California. Many people would rather fly to these airports with a change of plane than to San Francisco or Los Angeles airports nonstop.
Concerns about the possible anticompetitive effects of hub-and-spoke systems have been fueled by mergers and bankruptcies among some of the larger airlines in the last few years. Eight mergers among major airlines were approved in 1986 and 1987. Two of these mergers, Northwest-Republic and TWA-Ozark, involved airlines that shared the same primary hub. The Department of Transportation (DOT) approved these two combinations over the objections of participants from the Department of Justice.
The industry shakeout intensified following the August 1990 Iraqi invasion of Kuwait that increased jet fuel prices, for a brief period by more than 100 percent. Since then, America West, TWA and Continental have filed for Chapter 11 bankruptcy protection, but continued to operate. Midway, Pan Am, and Eastern have been liquidated, but only after hundreds of millions of shareholders’ and creditors’ dollars had been spent trying to revive these companies.
Despite the spate of airline mergers and failures, or some have argued because of them, domestic airline prices have not increased relative to costs since most new entry ended in the early 1980s. From the second quarter of 1984 to the second quarter of 1990, before the events in the Persian Gulf, prices increased 4 percent less than DOT’s index of airline costs. Many managers in the industry have claimed that cash flow requirements of airlines near bankrup...
Table of contents
- Cover Page
- Title Page
- Copyright Page
- Contents
- Acknowledgements
- Introduction
- PART I Deregulation and Liberalization
- PART II Business Models and Operating Characteristics
- PART III The Airline-Airport Relationship
- PART IV Network Characteristics
- PART V Pricing and Competition
- PART VI Impacts and Implications for the Future
- Name Index
Frequently asked questions
Yes, you can cancel anytime from the Subscription tab in your account settings on the Perlego website. Your subscription will stay active until the end of your current billing period. Learn how to cancel your subscription
No, books cannot be downloaded as external files, such as PDFs, for use outside of Perlego. However, you can download books within the Perlego app for offline reading on mobile or tablet. Learn how to download books offline
Perlego offers two plans: Essential and Complete
- Essential is ideal for learners and professionals who enjoy exploring a wide range of subjects. Access the Essential Library with 800,000+ trusted titles and best-sellers across business, personal growth, and the humanities. Includes unlimited reading time and Standard Read Aloud voice.
- Complete: Perfect for advanced learners and researchers needing full, unrestricted access. Unlock 1.5M+ books across hundreds of subjects, including academic and specialized titles. The Complete Plan also includes advanced features like Premium Read Aloud and Research Assistant.
We are an online textbook subscription service, where you can get access to an entire online library for less than the price of a single book per month. With over 1.5 million books across 990+ topics, we’ve got you covered! Learn about our mission
Look out for the read-aloud symbol on your next book to see if you can listen to it. The read-aloud tool reads text aloud for you, highlighting the text as it is being read. You can pause it, speed it up and slow it down. Learn more about Read Aloud
Yes! You can use the Perlego app on both iOS and Android devices to read anytime, anywhere — even offline. Perfect for commutes or when you’re on the go.
Please note we cannot support devices running on iOS 13 and Android 7 or earlier. Learn more about using the app
Please note we cannot support devices running on iOS 13 and Android 7 or earlier. Learn more about using the app
Yes, you can access Low Cost Carriers by Lucy Budd,Stephen Ison in PDF and/or ePUB format, as well as other popular books in Technology & Engineering & Transportation Industry. We have over 1.5 million books available in our catalogue for you to explore.