- 208 pages
- English
- ePUB (mobile friendly)
- Available on iOS & Android
eBook - ePub
About this book
Ranging from elegantly simple to extremely complex, a wide variety of flavors and fragrances stimulate our senses. It is difficult to understand the myriad sensory interactions involved because of the sheer complexity of their chemical composition. The aim of this text is to describe the use of chemometric techniques for understanding these complex systems and to serve as a practical guide to the acquisition, organization and reduction of chemical and sensory data. It explains chemical, sensory and multivariate analysis tools and their application. Pertinent concepts are discussed in-depth and are sufficiently illustrated with enough original data in complementary tables and figures to provide the basis for the execution of complex studies. The book emphasizes techniques that have been proven to work rather than those that "should" work from a theoretical standpoint. The book focuses on the acquisition of quality data and the subsequent interpretation of data rather than numerical computations used in data analysis. Chemometrics: Chemical and Sensory Data is an excellent resource for students and newcomers to flavor and fragrance research, as well as for experienced workers and product development managers.
Trusted by 375,005 students
Access to over 1.5 million titles for a fair monthly price.
Study more efficiently using our study tools.
Information
Topic
MedicineSubtopic
Biochemistry in MedicineChapter 1
Introduction
I. General Concepts
Most of the sensations that we experience in our everyday lives are complex. Quite often, we are not even aware of all the individual elements that combine to create the sensory impressions we experience. Current measurement methodologies in the sensory and physical sciences provide us with the tools to describe such complex phenomena in detail. In fact, we can now generate so much detailed information that it quickly overwhelms us. How then does one analyze the large volumes of data to find detailed information and identify relationships between chemical or physical measurements and sensory data? The application of systematic data reduction methodologies allows us to identify trends in large data sets and to study the interrelationships between data sets. Most of the techniques to be discussed are not new. The primary data analysis schemes include traditional univariate statistical and multivariate modeling algorithms.
The term chemometrics has traditionally been applied to chemical data. A similar application of many of the same techniques to sensory data is called psychometrics. For convenience, we will use the term chemometrics to include both types of data. When referring to sensory data, it is to be understood that psychometrics is implied.
A complete definition of chemometrics must include all aspects of data collection and data analysis. Massart, et al.1 provide a good working definition: “the chemical discipline that uses mathematical, statistical and other methods employing formal logic (1) to design or select optimal measurement procedures and experiments and (2) to provide maximum relevant information by analyzing chemical data.” As suggested by this definition, gathering the right data is as important as knowing how to analyze it. Therefore, we chose to cover the most important aspects of both chemical and sensory data collection and analysis. While the individual measurement techniques may vary, the general principles of data collection are applicable to all. Data collection aspects include the knowledge of experimental design, and instrumental and sensory measurements. Many of the same data analysis techniques are used in both the chemical and sensory disciplines, allowing the chemist to think about sensory information in familiar terms and vice versa. In fact, the chemist can consider the human as another type of instrument with which the sensory properties of chemicals are measured. No other instrument can provide such information.
For studies exploring the relationships between chemical and sensory data, measured variables are the amounts of individual chemical compounds in a sample and the sensory attributes that combinations of those compounds produce. In traditional terminology, the levels of the compounds would be considered independent variables and the sensory attributes the dependent variables. Whether dependent or independent, each set of measurements contain the following types of information:
- Variable — variable correlations
- Variable — sample relationships
- Sample — sample comparisons
In all but the simplest system, the probability of correlations between measured variables is real. Identification of the interrelationships between variables and the lack of relationships is important to the understanding of synergistic as well as independent phenomena. Such knowledge helps the sensory scientist to evaluate the effectiveness of his panel to discriminate specific product attributes and to compare the performance of the individual panelists. With this information, he may be able to eliminate some measurement variables because they are redundant, or identify the need for additional variables in order to properly describe all the characteristics of a given product. In a similar manner, the chemist can study the information contained in chemical data. Organic chemistry tells us that, to a first approximation, compounds of the same chemical class (e.g., aldehydes) will undergo the same chemical reactions and should be affected in a similar manner by a given sequence of process steps. We would expect positive correlations to exist between related chemicals that are affected in the same way by processing. This information is often useful for functional classification of unknown compounds. Alternately, product and precursor relationships are suggested by the presence of negative correlations between two variables. A total lack of correlation between variables indicates the presence of independent phenomena.
Variable — Sample relationships help the scientist to begin to identify those variables indicative of certain characteristics of the samples being tested. This information also helps to verify that the samples in a test set possess the characteristics that were intended. We can all intuitively relate to the potential importance of the presence or absence of different compounds in a product. It is more difficult to understand and identify the significance when a gradual, simultaneous change in several variables is present across a series of samples. In fact, the simultaneous variation of several variables can create differences so complex that even the experienced flavorist may have difficulty understanding and describing them. Properly calibrated measurement tools, both chemical and sensory, can pick up trends, and analysis of the data can clearly demonstrate their presence.
Sample — Sample comparisons demonstrate similarities and differences in the characteristics of the samples tested. In combination with the previously mentioned relationships, the magnitudes of the differences needed to elicit a measurable change can be estimated. This ideally simplifies the task of controlling numerous variables simultaneously by allowing one to focus on those that are primarily responsible for the observed differences. For example, knowing that a twofold change in the levels of alcohols does not cause a measurable difference in the impression of a flavor system might allow the flavor chemist to concentrate on controlling the variation in the level of aldehydes which have a larger impact on the flavor characteristics.
When sensory and chemical data are combined, meaningful conclusions can be drawn. These might include the effects of processing or formulation changes on composition, the effects of composition on sensory characteristics and ultimately identification of the preferred composition. Obvious applications would be the prediction of the effects of variations in raw materials on flavor character, the identification and qualification of equivalent raw material sources, studying the effects of process changes on product performance, and understanding flavor stability. The development of information to support patent applications, to police patent infringements, and many other applications for predicting product attributes or performance from chemical or sensory measurements are possible. Many of the concepts developed in subsequent chapters can be applied in product development independent of the tools used to measure product composition and performance.
II. Requirements for Success
A systematic approach to organizing and executing the various aspects of a complex study is absolutely necessary for successful implementation.2 To begin, one must have a good appreciation for all the different aspects of the study. This includes knowing the specific questions to be answered as well as understanding the strengths and limitations of the techniques being used to gather, analyze, and interpret the data. Ideally, one person with the breadth and depth in all pertinent areas would be the most successful at solving such a problem. Realistically, a team of people, each with their own expertise and an understanding of the expertise of the others, is the best way to approach such work. This is simply because of the time consuming and tedious nature of the work required to generate meaningful information.
For successful implementation of such a project, the data must be reproducible and contain the information of interest. These criteria apply to both the chemical and sensory data. While they are obvious, they are not always met. Adequate attention to detail is needed in order for these requirements to be satisfied.
The reproducibility of the data (precision) is actually more important than the absolute accuracy, since the relative variations between samples are what is studied. This does not mean that accuracy in not desirable; rather, it means that similar conclusions can be drawn for both relative magnitudes as well as absolute magnitudes. This is primarily a result of the scaling techniques used for data preprocessing. We all need to remember that one can have good precision in the absence of absolute accuracy but cannot have accuracy without precision.3
Obviously, the data must contain the information of interest. Too often, the wrong data or only partial data are gathered. Attempts to analyze such data and draw meaningful conclusions are usually not successful and the poor results are interpreted to mean that the chemometric approach to data reduction is not capable of providing useful information. Detailed planning is essential to ensure that the right data are gathered. Analysis of data that have already been gathered for different purposes, or that were gathered without a specific question in mind, is often doomed to failure simply because the information needed to answer the questions of interest is not present. The fastest computers and the most sophisticated software cannot make up for poor data or the use of the wrong data. Trends cannot be found that are not inherent in the data.
Automation of data collection and handling is not an absolute necessity but certainly makes large studies easier to execute. The volume of data generated is typically large and difficult to manage manually. Human errors must be minimized.
III. The Chemometric Approach
The typical approach to a chemometric study is outlined in Figure 1. As indicated, studies are often not completed with one pass; rather, they are iterative in nature. The results of each iteration improve with the refinement of the understanding of the information in the data.
A. Study Definition and Data Collection
Generation of the database is the most important step. As mentioned earlier, the data must contain the information of interest. Therefore, the study needs to be planned in detail. Planning can begin by defining the study in terms of specific questions that are to be answered.4 This approach helps one to determine what data need to be gathered, and if the questions can be answered simultaneously or must be addressed sequentially. Appropriate experimental designs must be considered.4, 5 and 6 Samples representing each characteristic of interest need to be included in the data set for comparisons. The samples should span the entire range of interest. It is dangerous to draw conclusions by extrapolation beyond the data set.
Figure 2 depicts some of the details that need to be considered in order to execute a complete chemometric study. While not all inclusive, the kinds of chemical, sensory and process information that might be considered during experiment planning are indicated. It provides a picture of the potential complexity of each part, the interactions leading to cause and effect relationships, and serves as a general guide to the types of information that can be useful. As indicated, it may be necessary to gather both chemical and sensory information with different techniques in order to adequately address all the characteristics in a given set of samples. Consequently, it may be appropriate to analyze subsets of the entire database with different data reduction techniques depending on the methodology used to gather the data and the experimental design.5, 6 and 7
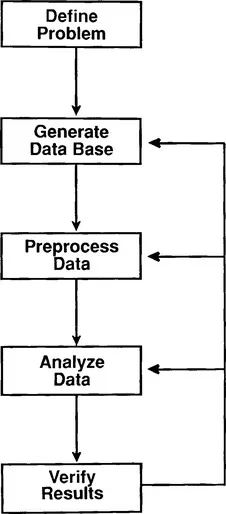
FIGURE 1. The chemometric approach. Several iterations are required to complete a study.
Initially, it is advisable to keep chemometric studies simple. This means that the researcher should limit the number of questions to be answered or the range of the sample characteristics to be studied. Smaller studies are easier to manage and the results easier to interpret. They allow one to develop familiarity with methodologies and confidence in the approach. As more experience and knowledge are gained, studies can be expanded by increasing the complexity of design or by combination of smaller data sets to answer several questions simultaneously.
More complete discussions about the size of the data base are contained in the discussions of specific techniques. However, it is instructive to mention some general concepts here. Most chemical and sensory data are not well behaved in a statistical sense. They may not have been collected according to a rigorous experimental design where all variables could be cont...
Table of contents
- Cover
- Title Page
- Copyright Page
- Table of Contents
- Chapter 1 Introduction
- Chapter 2 Sample Preparation and Extraction Techniques
- Chapter 3 Instrumental Considerations
- Chapter 4 Preprocessing: Preparation for Data Analysis
- Chapter 5 Chemical Senses
- Chapter 6 Measuring Sensitivity
- Chapter 7 Measuring Sensation Magnitude: Scaling Methods
- Chapter 8 Collection of Sensory and Chemical Data for Tea
- Chapter 9 Correlation and Regression
- Chapter 10 Discriminant Analysis
- Chapter 11 Factor Analysis
- Index
Frequently asked questions
Yes, you can cancel anytime from the Subscription tab in your account settings on the Perlego website. Your subscription will stay active until the end of your current billing period. Learn how to cancel your subscription
No, books cannot be downloaded as external files, such as PDFs, for use outside of Perlego. However, you can download books within the Perlego app for offline reading on mobile or tablet. Learn how to download books offline
Perlego offers two plans: Essential and Complete
- Essential is ideal for learners and professionals who enjoy exploring a wide range of subjects. Access the Essential Library with 800,000+ trusted titles and best-sellers across business, personal growth, and the humanities. Includes unlimited reading time and Standard Read Aloud voice.
- Complete: Perfect for advanced learners and researchers needing full, unrestricted access. Unlock 1.5M+ books across hundreds of subjects, including academic and specialized titles. The Complete Plan also includes advanced features like Premium Read Aloud and Research Assistant.
We are an online textbook subscription service, where you can get access to an entire online library for less than the price of a single book per month. With over 1.5 million books across 990+ topics, we’ve got you covered! Learn about our mission
Look out for the read-aloud symbol on your next book to see if you can listen to it. The read-aloud tool reads text aloud for you, highlighting the text as it is being read. You can pause it, speed it up and slow it down. Learn more about Read Aloud
Yes! You can use the Perlego app on both iOS and Android devices to read anytime, anywhere — even offline. Perfect for commutes or when you’re on the go.
Please note we cannot support devices running on iOS 13 and Android 7 or earlier. Learn more about using the app
Please note we cannot support devices running on iOS 13 and Android 7 or earlier. Learn more about using the app
Yes, you can access Chemometrics by David R. Burgard in PDF and/or ePUB format, as well as other popular books in Medicine & Biochemistry in Medicine. We have over 1.5 million books available in our catalogue for you to explore.