![]()
1 A tipping point
During the height of South Africa’s load-shedding crisis in 2015, Robbie van Heerden, Eskom’s system operator at the time, would leave home before dawn and make the short journey from his home in the south of Johannesburg to Eskom National Control, which lies about 20 km east of the city. He wanted to be positioned in front the control room’s multi-storey video wall well before 5 am, when the country’s electricity demand would begin its inevitable climb towards its morning peak.
Situated alongside the Victoria Lake yacht club, in Germiston, and only a few kilometres down the road from the world’s largest precious metals refinery, the Rand Refinery, the white-tile-clad building does little to betray its status as a national key point. Nevertheless, the National Control was thrust unceremoniously into the limelight in 2015 as citizens learned just how important it was in determining whether daily rotational power cuts would take place and for how long. South Africa was gripped, at the time, with the threat of a ‘national black-out’, a recovery from which could take more than two weeks. Hourly load-shedding radio reports became essential listening, with collective sighs of relief when cuts were restricted to ‘Stage 1’, or 1 000 MW of rotational cuts. Anxiety levels rose considerably, though, on those days when ‘Stage 3’ (3 000 MW) load shedding was communicated. Such announcements generally set social media ablaze with warnings of the kind of catastrophic black-out load shedding was, ironically, designed to prevent.
Apart from the reputational damage suffered by Eskom, the power cuts came with some very real social and economic consequences, losing about a percentage point of gross domestic product and lowering business confidence. For a businessperson, the cuts had serious top- and bottom-line implications, affecting operating hours, as well as staffing, maintenance and investment decisions. Energy-intensive companies bore the brunt of it. They were not only forced to trim consumption by 10%, but were also first in line for additional curtailment, before the unpopular decision of load-shedding households was taken. For private citizens, the schedules determined everything from homework and leisure routines to when and how meals were prepared, with a tiny minority of callers to radio talk shows actually claiming to enjoy the candle-lit ambiance delivered courtesy of Eskom. For the system operators at National Control there was no place for levity, however. Every day, but especially during the morning and evening peaks, was a white-knuckle ride, with unplanned plant outages making system forecasting and scheduling almost impossible.
In the control room, the full-colour screens glowed with numbers and graphs; no matter how dark the surrounding areas might have been at the time. For his part, Van Heerden would focus almost exclusively on one number and one screen. That screen showed system frequency as measured in Hertz (Hz), while the number he was looking for was always 50. Eskom, as is the case with most system operators globally, works within a frequency band of between 49.5 Hz and 50.5 Hz. The goal, though, is always 50 Hz, which is indicative of a controlled flow of alternating current power from multiple generators through the network, or the sum of the output of multiple generators instantaneously equalling the sum of all customer demand. Generation output is changed every four seconds to match customer demand. But when there is insufficient generation available, as was frequently the case during the first half of 2015, customer demand is reduced to ensure system stability. Van Heerden uses the analogy of a fully-laden truck moving up a hill at 30 km/h. If the engine capacity is too small for the truck’s load, the engine slows, which in electricity terms, translates to a drop in system frequency. To prevent the truck engine from stalling, load is shed or, in the case of electricity, controlled manual load shedding is initiated.
On a winter morning in South Africa, demand can rise from as low as 24 000 MW at 5 am to over 30 000 MW by 7 am, where it plateaus for most of the working day. Demand begins to rise again at around 5 pm, picking up by a material 3 000 MW in about an hour, before peaking just after 6 pm. Every day is different, though, and during the 2015 load-shedding crisis, even small supply or demand events had the potential to destabilise a system being held together in the absence of the normal 2 000 MW operating reserve. National Control was, thus, continually on the hunt for additional supply or ways to reduce demand. Arrows in the quiver included the diesel-fuelled open-cycle gas turbines, demand-reduction contracts with industry, some imports and the Hillside aluminium pot lines, which could be switched off for a few hours on a weekly rotation. There was also tremendous vigilance for any ‘peaks within the peak’, which could result in the frequency falling precipitously. Every day provided a new adrenalin rush, Van Heerden reflects. However, those daily anxieties would have never arisen had the authorities heeded National Control’s warning, made in the late 1990s, that new capacity should be in place by 2007 to guarantee security of supply.
This nightmare scenario for South Africans, which played itself out most intensively in 2015, but which emerged as a real threat all the way back in 2006, is only partly attributable to a failure of planning. In the event, the growth-sapping gap between theoretical capacity and actual plant availability arose as result of a series of calamitous policy, regulatory and corporate decisions. The Department of Energy’s own 1998 White Paper Energy Policy stated that ‘although growth in electricity demand is only projected to exceed generation capacity by approximately the year 2007, long capacity-expansion lead times require strategies to be in place in the mid-term, in order to meet the needs of the growing economy’.1 Nevertheless, the events brought home the importance of planning, as well as adherence to plans. Indeed, had Eskom implemented, or been allowed to implement, its own plan, the first new capacity would most likely have been ramping up at the very time when the power cuts were becoming a daily threat.
System planning
Credible power system planning begins with a demand forecast, as well as with assumptions about the residual lifetime of existing generation assets. In any power system, the supply gap widens over time, either because demand is increasing, or because an existing plant is being decommissioned, or both. In other words, a supply gap arises not only because of increases in demand, but also because, at some point, old power stations become too expensive and inefficient to keep operational.
The supply gap needs to be filled with new generation assets, and ideally it needs to be filled a few years ahead of time so as to prevent the type of load-shedding described previously. This is as true for centrally planned power systems, such as South Africa’s, as it is in more liberalised markets. The only difference being that, in a centrally planned system, the demand/supply forecast is done by the central planner, while in liberalised power systems the individual market participants are forecasting demand and supply-side options independently. The overall objective is the same: to determine if and when a new-build power station investment decision makes sense. Settling on such a forecast is an intricate process. It involves the use of models that produce a forecast using input assumptions relating to economic growth, as well as the power-intensity of that growth.
Forecasts will always diverge from reality, which is why system planners habitually produce more than one scenario and rely on regular updating to keep deviations in check. In the case of South Africa, forecasters typically calculate low-, medium- and high-growth scenarios, with the demand forecast eventually selected for use by power-system planners arising from a consultation process involving system operators at Eskom, academics, large customers and research councils. The forecast selected for the 2010 version of South Africa’s Integrated Resource Plan (IRP) proved wildly optimistic. The document, which was promulgated in 2011, predicted that electricity demand would grow by 2.8% a year between 2010 and 2030,2 which would have seen yearly electricity demand double over the period to 454 TWh, from 250 TWh. This demand includes not only South African end-customer consumption, but also exports and grid losses.
In reality, though, domestic electricity consumption has flattened since 2010 and the Energy Intensive Users Group (EIUG), which represents the 32 large companies that consume about 40% of South Africa’s electricity, believes demand assumptions should be moderated even further.3 The organisation says South Africa’s electricity demand has not grown since 2007, owing to several factors related to the change in the economic structure of South Africa, including the lack of generation capacity.
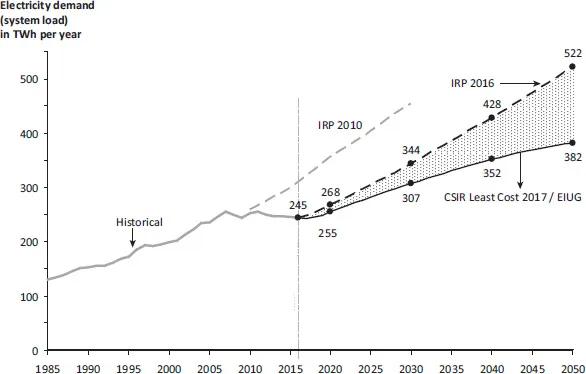
The forecast has since been moderated considerably (see Figure 1.1), reflecting an assumed growth path that rises from 245 TWh a year to only around 382 TWh a year in 2050. Undoubtedly, this demand assumption will also be proved incorrect. Nevertheless, in light of South Africa’s stage of development, as well as the country’s ongoing population growth and its industrialisation ambitions, planners believe it prudent to plan for expansion, as underestimating demand will prove more damaging than any overestimation. Assuming lower demand would be to expect South Africa’s already relatively modest per-capita consumption to fall even further, which would arguably imply economic catastrophe. Indeed, even if South Africa achieved the IRP 2016’s original yearly demand assumption of 522 TWh by 2050 (currently deemed exceedingly optimistic) the country would simply have increased per-capita consumption to a level currently enjoyed in Australia – a mining economy with many structural similarities. It would also discount prospects for new demand, which could arise from electric vehicles, or increasing shares of electrification in industrial and residential heat provision. If South Africa has learned anything from its recent load-shedding crisis surely it must be that the negative consequence of stranded generation assets is significantly smaller than not having sufficient electricity.
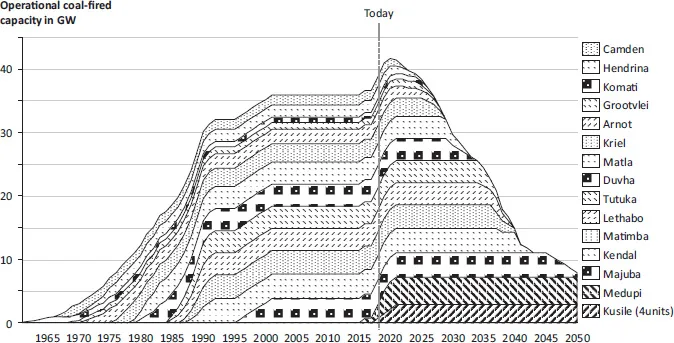
On the supply side, meanwhile, any phasing out of existing generation assets is also forecast to create a complete picture of the anticipated generation gap. In the case of South Africa, which has a relatively mature fleet of coal power stations, the retirement of plants, particularly from around 2030 onwards, cannot be ignored (see Figure 1.2).
Figure 1.1 Historic electricity demand in South Africa (including exports to the region) until 2016, as well as demand forecasts from IRP 2010, IRP 2016 and CSIR Least Cost 2017 / EIUG until 2050
Figure 1.2 Existing Eskom coal fleet and its scheduled decommissioning dates over time
Once the demand forecast and the decommissioning schedule of the existing power stations are agreed, system planners then begin the task of matching new-build supply options to the widening supply gap, using a mathematical model that has but one objective function: determining the least-cost generation mix over the planning horizon within a firm, non-negotiable boundary condition of stipulated system reliability. Besides cost, contemporary planners also strive for an outcome that ensures a reduced environmental impact. Therefore, additional boundary conditions are included in the model, outlining the specific environmental thresholds that should not be breached, such as carbon-emission limits.
Planners then go about filling the supply gap in the least-cost manner, subject to the constraints imposed. They determine the least-cost mix by inputting individual cost items associated with the available generation technologies, such as the capital outlay to build the plant, the fixed operations and maintenance cost to own the plant, and the variable cost (predominately fuel) to operate the plant, together with the technical specifications of the different supply options. The mathematical model then determines how – with all the supply options available, their costs and their technical characteristics – the future electricity demand can be met at the least cost, while remaining within the boundary conditions of system reliability and environmental constraints. The objective function and the key output of such a model, together with the cost-optimal investment mix, is the present value of the total cost to build and operate the power system from today until the end of the planning horizon, say 2050.
Levelised cost of energy (LCOE)
Another output is the predicted utilisation of the individual plants that the model has selected to build. The utilisation, together with the cost per technology, leads to the cost per energy unit produced. In the case of South Africa, the cost is stated in Rand per kilowatt-hour (R/kWh) for each technology. This is called the Levelised Cost of Energy, or LCOE. It is important to note that one can only calculate LCOE by making an assumption about what the utilisation of a certain power plant will be. The ut...