![]()
1
Introduction
1.1 General Classes of Power Quality Problems
Many different types of power quality measurement devices exist and it is important for employees in different areas of power distribution, transmission, and processing to use the same language and measurement techniques.
The IEEE Standards Coordinating Committee 22 (IEEE SCC22) has framed power quality standards in the United States. The Industry Applications Society and the Power Engineering Society along with IEEE played a major role in framing standards. The International Electro technical Commission (IEC) classifies electromagnetic phenomena into the sets presented in Table 1.1.
The power quality standard for IEC was developed by monitoring electric power quality for U.S. industries. Sag is a synonym to the IEC term dip. The category short-duration variations includes voltage dips, swell, and short interruptions. The word swell is an exact opposite to sag (dip). The category long-duration variation deals with American National Standards Institute (ANSI) C84.1 limits. The broadband conducted phenomena are under the category of noise. The category waveform distortion contains harmonics, interharmonics, DC in AC networks, and notching phenomena. The IEEE Standard 519–1992 explains the concept related to harmonics.
Table 1.2 shows the electromagnetic phenomena categorization related to power quality community. The listed phenomena in the table can be further listed in detail by appropriate attributes.
The following attributes can be used for steady-state phenomena:
• Amplitude
• Frequency
• Spectrum
• Modulation
• Source impedance
• Notch depth
• Notch area
For non-steady-state phenomena, other attributes may be required:
• Rate of rise
• Amplitude
• Duration
• Spectrum
• Frequency
• Rate of occurrence
• Energy potential
• Source impedance
TABLE 1.1
Principal Phenomena Causing Electromagnetic Disturbances as Classified by IEC
| • Conducted low-frequency phenomena 1. Harmonics, interharmonics 2. Signal system (power line carrier) 3. Voltage fluctuations (flicker) 4. Voltage dips and interruptions 5. Voltage imbalance (unbalance) 6. Power frequency variations 7. Induced low-frequency voltages 8. DC in AC networks |
| • Radiated low-frequency phenomena 1. Magnetic fields 2. Electric fields |
| • Conducted high-frequency phenomena 1. Induced Continuous Wave (CW) voltages or currents 2. Unidirectional transients 3. Oscillatory transients |
| • Radiated high-frequency phenomena 1. Magnetic fields 2. Electric fields 3. Electromagnetic fields 4. Continuous waves 5. Transients |
| • Electrostatic Discharge Phenomena (EDP) |
| • Nuclear Electro Magnetic Pulse (NEMP) |
TABLE 1.2
Categories and Characteristics of Power System Electromagnetic Phenomena
Categories | Typical Spectral Content | Typical Duration | Typical Voltage |
Transient Impulsive | | | |
Nanosecond | 5-ns rise | <50 ns | |
Microsecond | 1-µs rise | 50 ns–1 ms | |
Millisecond | 0.1-ms rise | > 1 ms | |
Oscillatory | | | |
Low frequency | <5 kHz | 0.3–50 ms | 0–4 pu |
Medium frequency | 5–500 kHz | 20 µs | 0–8 pu |
High frequency | 0.5–5 MHz | 5 µs | 0–4 pu |
Short-duration variations | | | |
Instantaneous | | | |
Interruption | | 0.5–30 cycles | <0.1 pu |
Sag (dip) | | 0.5–30 cycles | 0.1–0.9 pu |
Swell | | 0.5–30 cycles | 1.1–1.8 pu |
Momentary | | | |
Interruption | | 30 cycles–3 s | <0.1 pu |
Sag (dip) | | 30 cycles–3 s | 0.1–0.9 pu |
Swell | | 30 cycles–3 s | 1.1–1.4 pu |
Temporary | | | |
Interruption | | 3 s–1 min | <0.1 pu |
Sag (dip) | | 3 s–1 min | 0.1–0.9 pu |
Swell | | 3 s–1 min | 1.1–1.2 pu |
Table 1.2 shows each category of electromagnetic phenomena regarding typical spectral content, duration, and magnitude. The categories and their descriptions provide the cause of power quality problems.
1.2 Types of Power Quality Problems
Defining and understanding the diverse power quality problems helps to prevent and solve those problems. The type of power quality problem is identified by the signature or characteristics of the disturbance. The variation in behavior of the sine wave, i.e., voltage, current, and frequency, recognizes the type of power quality problem. The most common type of power quality problem is voltage sag. Table 1.3 shows the sources, causes and effects of typical power quality problems.
TABLE 1.3
Summary of Power Quality Problems
Example Wave Shape or RMS Variation | Causes | Sources | Effects | Examples of Power Conditioning Solutions |
| Impulsive transients (Transient disturbance) | • Lightning • Electrostatic discharge • Load switching • Capacitor switching | • Destroys computer chips and TV regulators | • Surge arresters • Filters • Isolation transformers |
| Oscillatory transients (Transient disturbance) | • Line/cable switching • Capacitor switching • Load switching | • Destroys computer chips and TV regulators | • Surge arresters • Filters • Isolation transformers |
| Sags/swells (RMS disturbance) | • Remote system faults | • Motors stalling and overheating • Computer failures • ASDs shutting down | • Ferroresonant transformers • Energy storage technologies • Uninterruptible Power Supply (UPS) |
| Interruptions (RMS disturbance) | • System protection • Breakers • Fuses • Maintenance | • Loss production • Shutting down of equipment | • Energy storage technologies • UPS • Backup generators |
| Undervoltages/overvoltages (steady-state variation) | • Motor starting • Load variations • Load dropping | • Reduces life of motors and lightning filaments | • Voltage regulators • Ferroresonant transformers |
| Harmonic distortion (steady-state variation) | • Nonlinear loads • System resonance | • Overheating transformers and motors • Fuses blow • Relays trip • Meters malfunction | • Active or passive filters • Transformers with neglecting zero sequence components |
| Voltage flicker (steady-state variation) | • Intermittent loads • Motor starting • Arc furnaces | • Lights flicker • Irritation | • Static VAR systems |
1.2.1 Voltage Sags (Dips)
IEEE Standard P1564 gives the recommended indices and procedures for characterizing voltage sag performance and comparing performance across different systems. Also, a new IEC Standard 61000-2-8 titled “Environment – Voltage Dips and Short Interruptions” has come recently. This standard warrants considerable discussion within the IEEE to avoid conflicting methods of characterizing system performance in different parts of the world.
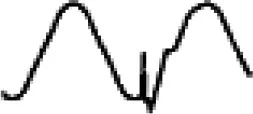
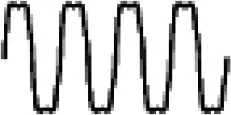
Voltage sags are named as voltage dips in Europe. Decline in voltage for a short time is defined by IEEE as voltage sag. The voltage sag lasts for 0.5 cycles to 1 minute. The voltage magnitude between 10%–90% of the normal Root Mean Square (RMS) voltage is stated as voltage sag. The RMS or effective value of a sine wave is equal to the square root of the average of the squares of all the instantaneous values of a cycle and is equivalent to times the peak value of the sine wave, as shown in Figure 1.1.
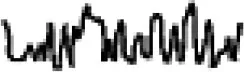
Figure 1.2 shows that voltage comes back to normal value after a 0.12 second voltage sag. Voltage sag occurs only for short periods.
Voltage sags occurs on transmission and distribution systems by both utilities and end users. For example, the utility power system is affected by transformer failure that results in voltage sag. The energy is supplied by power system for faults. The fault in the utility power system causes voltage sag. As the fault is cleared, the voltage comes to normal. Sags due to transmission system lasts about 6 cycles (or 0.10 seconds). Distribution faults occur for more time than transmiss...