Marketing Planning in a Total Quality Environment is a how-to book designed for the marketing practitioner. It provides detailed information on how to prepare and implement a marketing plan based in a total quality environment.For the last twenty years, the authors, as marketing practitioners and educators, have been deeply involved in the planning processes of many corporations. This book, Marketing Planning in a Total Quality Environment, is the product of what they've learned over the years from working with these diverse corporations and their executives. The authors provide readers with each step in the total quality planning process, complete with check sheets and plan formats. After readers finish the book, they can prepare a quality-driven marketing plan that will be used and followed throughout the year--instead of becoming a shelf item.This book is for you and the many other marketing professionals who are faced with one or more of these situations:
You're doing a good job, but you'd like to do even better.
You're spending valuable time putting out fires. You lack time to do the things that need to be done.
You're always having a hard time coordinating major marketing programs.
You're faced with a major discrepancy between where you are and where you'd like to be; you've got a planning gap.
You realize that you've got to offer your customers more quality if you're going to be competitive in the new market environment.
You'd like to have a professional annual marketing plan--one that will be well received by management and will also keep you and your staff focused throughout the year.
Because each step on how to develop a marketing plan is covered, Marketing Planning in a Total Quality Environment is ideal for presidents of smaller firms, marketing directors and planners, product managers, and planning specialists. The authors include a sample fact book which can be used to store and analyze data, planning forms which help convert data into information, and marketing plan formats which ensure that the plan will get used.
Trusted by 375,005 students
Access to over 1.5 million titles for a fair monthly price.
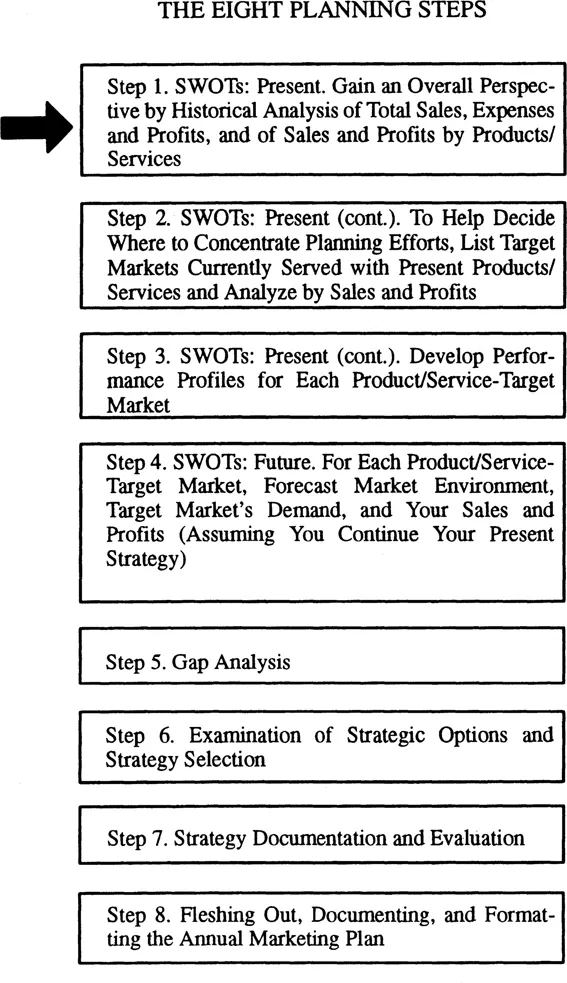
Gain an Overall Perspective by Historical Analysis of Total Sales, Expenses and Profits, and of Sales and Profits by Products/Services
Business-Unit Analysis
Examine your business-unit data first. If you’re in charge of marketing, you do this as a matter of course. But make an overall analysis of your business unit even if your responsibility is limited to preparing an annual marketing plan for a product or service. Such an analysis will give you a better understanding of your business unit’s growth, profits, and cash flow. You’ll gain a sharper perspective of the financial opportunities and threats facing your business unit. And, you’ll be able to compare the performance of your product/service to that of the overall performance of the business unit.
Examine Financial Statements
You’ll want to analyze three statements: profit-and-loss, balance sheet (if you’re examining company data), and cash flow. You can learn a lot from looking at one year’s statements. But analyzing historical trends usually yields better insights.
Looking at the profit-and-loss statements, what does the sales trend suggest? If sales growth has been stagnant or declining, there may be great pressure to increase sales. What about gross margins? Are they being squeezed, year by year? What’s the trend of expenses? Return on sales?
Turning to the balance sheets, what’s the trend of key ratios, such as leverage (debt/equity), liquidity (current, quick), and activity (inventory turns and average collection period)?
Examine your statements of cash flow. Is the cash situation satisfactory? Is it improving? Or is it getting worse?
Make Industry Comparisons
Business unit statistics and ratios, such as order backlog and inventory turnover, can by themselves be helpful. However, additional insights can usually be gained by comparing company statistics and ratios with industry averages. For example, even if your sales and profits have been increasing, how do they look in relation to comparative companies.
Your products/services and target markets probably will not be exactly comparable with the composite of the firms that make up the industry average. Still, a comparison of statistics and ratios may point out that you’re doing far better than most, indicating that, at least in this industry, you’re doing many things right. Or, conversely, these comparisons may show that you’re below average, signaling that change is probably warranted.
Sources for industry averages include Dun & Bradstreet and your industry association.
Adjust Financial Statements for Inflation
Perhaps your business unit does not adjust sales, profits, etc., for inflation. If so, think about making such compensations. (See Appendix A for methodology.)
Inflation can distort information. For example, in 1983, the president of a small firm was shocked to learn that between 1973-1982 his company’s sales, when adjusted for inflation, were down over 50 percent. He had thought sales were merely flat because he had been monitoring them using nominal dollars instead of constant dollars.
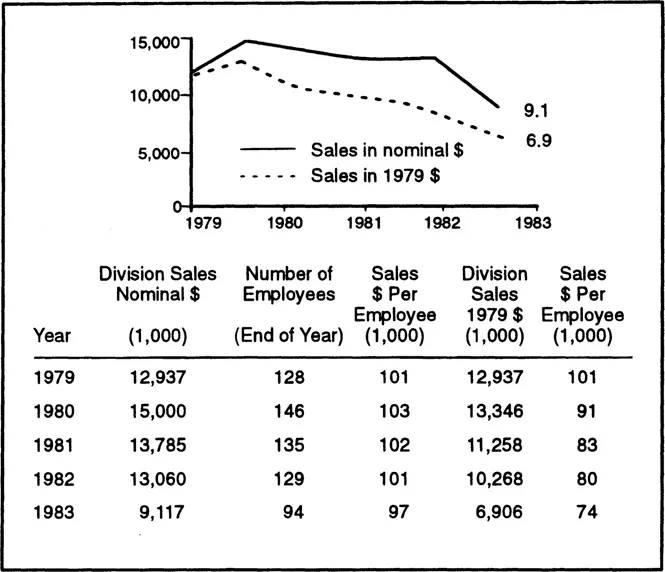
In another case (see Figure 2.1), a wholesaling company’s current sales were overstated by 24 percent because of inflated dollars. Furthermore, these inflated dollars made other analyses misleading. To wit, sales (in dollars) per employee (a critical measurement for wholesalers) was overstated by $20,000. This led management to believe that the sales (in dollars) per employee ratio was satisfactory. In fact, employee productivity had declined by 27 percent.
FIGURE 2.1
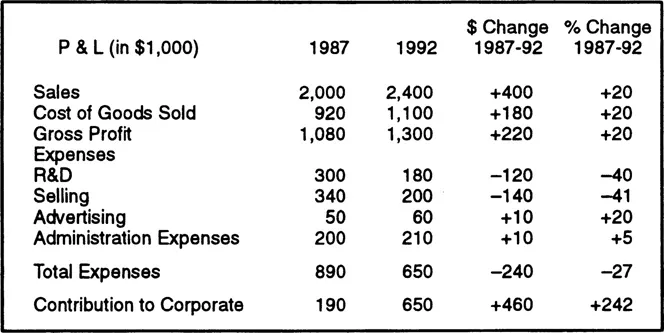
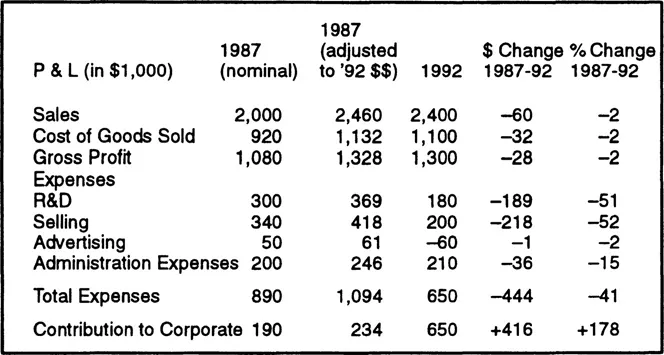
A look at the Micron case also shows the importance of dealing with dollars adjusted for inflation. A comparison of FY ‘87 and FY ‘92 P & Ls (unadjusted) points out how, among other changes, sales have increased by 20 percent. (Note Figure 2.2.) However, when adjusted for inflation, using the CPI-U, All Items, the picture changes, as Figure 2.3 points out.
FIGURE 2.2
FIGURE 2.3
Sales, instead of increasing by 20 percent, have declined by 2 percent. Furthermore, the decline in expenditures for R&D and selling are greater than indicated by nominal dollar comparison. In fact, $407,000 of Micron’s $416,000 (about 98 percent) increase in contribution to corporate can be attributed to cutbacks in R&D and selling expenditures (versus 57 percent under nominal dollar comparison).
Inflation, even in years of relatively low inflation-say 4 percent-does add up. If you’re using a five-year analysis, that amounts to, compounded, 21.7 percent. For many companies that would create quite a distortion.
Product/Service Analysis
Examine the present and historical sales and profits of products/ services (more detailed analyses, such as by sales persons, territory, or customers, will come later). Ideally, you’d have pretax income for each product/service. But most likely that will not be the case. You’ll have to use some lesser measure of profit, such as gross profit.
Set up your analysis so you can make comparisons from year to year. See Figure 2.4 (this table assumes that you can measure gross profit for each product/service). Again, constant dollars will give you a better perspective. But suppose that you have a number of products/services that you market as a line of products, such as varieties of canned soup? Then analyze these as a group.
FIGURE 2.4
How Accurately Does Your Organization Measure Costs?
Be sure to analyze allocated costs. The way your organization is allocating costs may be a suitable procedure for custodial purposes, such as profit-and-loss reports for income tax purposes and shareholder reports. But for analyzing the profit and loss of products and services it may fall woefully short.
Here’s why. For example, suppose your organization follows traditional full-cost accounting, utilizing allocated costs. This is the way it works:
Full-Cost Accounting
Sales
–
Cost of Goods Sold (Purchases of components, raw materials and direct and indirect manufacturing costs)
=
Gross Profits
–
Operating Expenses (Including general and administration overhead allocation)
=
Pretax Income
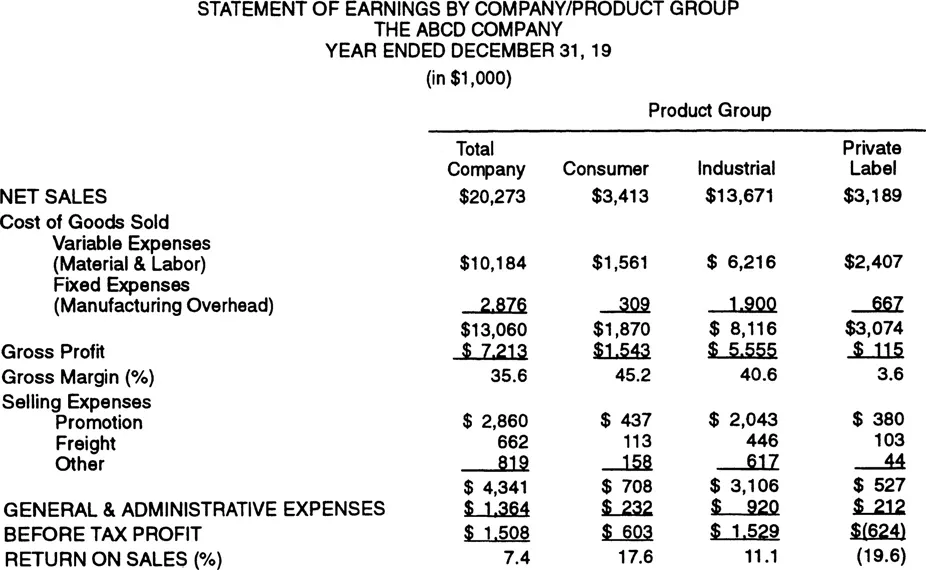
Such an accounting procedure may send false signals. Examine the statement found in Figure 2.5, which shows year-end earnings for the ABCD Industrial Company (fictitious).
FIGURE 2.5
At first glance it appears that ABCD’s private label group should be dropped, since it has caused a $624,000 drain on company earnings. Yet closer examination reveals that the private label group has absorbed $879,000 of allocated costs—$667,000 of manufacturing overhead and $212,000 of general and administrative costs. Could manufacturing overhead and general and administrative costs be cut back by $879,000 if the private group were discontinued? In many cases allocated costs are fixed or sunk and may or may not be directly related to whether a particular product group is or is not discontinued.
Activity-Based Costing (ABC)
Sometimes called activity-based accounting, ABC is a better approach to determining profitability than traditional full-cost accounting.
If your organization has adopted activity-based costing (ABC), you can skim the rest of this step. But be sure you carefully analyze major cost drivers and how costs are allocated.
ABC is defined as:
A system that focuses on activities as the fundamental cost objects and uses these building blocks for compiling the costs of products and other cost objects.1
Costs are calculated, individually, for each activity. To do this, major cost drivers are determined within each activity. And here are the basic differences between ABC and traditional full cost accounting: (1) No single factor, such as labor, determines manufacturing/operations costs, and (2) Activities cut across department lines. The product or service cost is then “built up” from the cost of the various activities required to manufacture the product or deliver the service.
A “rudimentary” ABC example is given in Figure 2.6. Note how the costs of “miles to store” and “yard time” were split apart. Under traditional full-cost accounting, this would probably not have been done. (If you’d like an excellent easy-to-get source on ABC, see Terrance P. Pore, “A New Tool for Managing Costs,” Fortune, June 14, 1993, pp. 124-129, which provides a good overview of ABC, giving examples of how companies h...
Table of contents
Cover
Half Title
Haworth
Title Page
Copyright Page
Table of Contents
Preface
Acknowledgements
SECTION I: INTRODUCTION
SECTION II: THE EIGHT PLANNING STEPS
SECTION III: RETROSPECT AND EXPECTATION
SECTION IV: APPENDIXES
Notes
Index
Frequently asked questions
Yes, you can cancel anytime from the Subscription tab in your account settings on the Perlego website. Your subscription will stay active until the end of your current billing period. Learn how to cancel your subscription
No, books cannot be downloaded as external files, such as PDFs, for use outside of Perlego. However, you can download books within the Perlego app for offline reading on mobile or tablet. Learn how to download books offline
Perlego offers two plans: Essential and Complete
Essential is ideal for learners and professionals who enjoy exploring a wide range of subjects. Access the Essential Library with 800,000+ trusted titles and best-sellers across business, personal growth, and the humanities. Includes unlimited reading time and Standard Read Aloud voice.
Complete: Perfect for advanced learners and researchers needing full, unrestricted access. Unlock 1.5M+ books across hundreds of subjects, including academic and specialized titles. The Complete Plan also includes advanced features like Premium Read Aloud and Research Assistant.
Both plans are available with monthly, semester, or annual billing cycles.
We are an online textbook subscription service, where you can get access to an entire online library for less than the price of a single book per month. With over 1.5 million books across 990+ topics, we’ve got you covered! Learn about our mission
Look out for the read-aloud symbol on your next book to see if you can listen to it. The read-aloud tool reads text aloud for you, highlighting the text as it is being read. You can pause it, speed it up and slow it down. Learn more about Read Aloud
Yes! You can use the Perlego app on both iOS and Android devices to read anytime, anywhere — even offline. Perfect for commutes or when you’re on the go. Please note we cannot support devices running on iOS 13 and Android 7 or earlier. Learn more about using the app
Yes, you can access Marketing Planning in a Total Quality Environment by William Winston,John L Stanton,Robert E Linneman in PDF and/or ePUB format, as well as other popular books in Business & Business General. We have over 1.5 million books available in our catalogue for you to explore.