- 636 pages
- English
- ePUB (mobile friendly)
- Available on iOS & Android
eBook - ePub
New Frontiers in Microsimulation Modelling
About this book
In the past fifteen years, microsimulation models have become firmly established as vital tools for analysis of the distributional impact of changes in governmental programmes. Across Europe, the US, Canada and Australia, microsimulation models are used extensively to assess who are the winners and losers from proposed policy reforms; this is now expanding into new frontiers, both geographically and in terms of policy areas. With contributions from more than 60 international experts, this volume offers a comprehensive introduction to the state of microsimulation internationally, illustrating a wide range of new applications and approaches. It will be of relevance to government policy makers, social policy planners, economists and those concerned with predicting the impact of public policy change and to academics in a variety of disciplines, especially social and public policy, human geography, development studies and economics.
Trusted by 375,005 students
Access to over 1.5 million titles for a fair monthly price.
Study more efficiently using our study tools.
Information
Part I:
Spatial Modelling
Chapter 2
Moses: Dynamic Spatial Microsimulation with Demographic Interactions
Mark Birkin / Belinda Wu / Phil Rees
1 Introduction
Microsimulation models have been used extensively to address distributional questions in a population. The work on dynamics is perhaps less voluminous, but still substantial (a comprehensive review is provided by O'Donoghue, 2001; for a more recent statement of challenges and issues, see Harding, 2007). The challenges in dynamic modelling of a population are considerable, yet multiplied further when there are several sub-populations, as within a spatial microsimulation. In order to moderate this problem, the most popular approach has been "static dynamic" (e.g. Ballas et al., 2004), in which a base population is regenerated synthetically to match independent forecasts of the overall population structure. In addition to the question of dimensionality – the existence of multiple sub-populations by definition includes parallel modelling of a number of demographic groups – tine most important challenge is to capture interactions between these sub-populations, and in a geographical context in particular to assess patterns of migration within and between local neighbourhoods. While the well-known Sverige model is one notable earlier attempt to capture spatial dynamics within a microsimulation framework (Rephann and Holm, 2004) this model adopts quite large spatial units and treats regions as closed systems without attempting to model local interactions. On the other hand, the SMILE model (Ballas et al., 2005) includes migration between Irish counties. The work of Duley (1989) incorporates small area migration data only in the context of inter-censal population updating. This report therefore documents a distinctive attempt to meet the challenge of modelling spatial dynamics with local demographic interactions.
It will be seen that the difficulties to be surmounted in constructing a spatial microsimulation model with explicit dynamics remain formidable. Nevertheless the benefits from successful prosecution of such a campaign would be extensive. The advantages in representing demographic processes through microsimulation, in contrast to traditional cohort-based approaches, have been eloquently stated by van Imhoff and Post (1998:105-107), turning on the detailed simultaneous representation of multiple demographic characteristics, and the representation of interactions between processes and between individuals. Such a model could also provide unique and valuable benefits to urban planners and policy-makers, with responsibility for far-reaching policy decisions regarding questions from sustainable development, environmental quality, housing and transport to equity and efficiency in the provision of health, education, social care, and the regulation of an extensive range of public and private services from retailing to crime prevention (Clarke and Birkin, 2008). Typically such decisions are made in the context of a very limited understanding of demographic trends and processes, whether independently or in response to specific policy influences (for example, if I approve this new housing programme, to what extent will it meet future housing needs: and how will it affect housing market behaviours in such a way that those needs are themselves changed?).
The remainder of the chapter is structured as follows. In Section 2, the Moses model is introduced and the major demographic components are described. A substantial section is then devoted to the means for modelling migration between local neighbourhoods. The fourth section of the chapter presents some indicative results and model benchmarks, before the chapter concludes with a discussion and review of next steps.
2 Structure of the Moses model
2.1 Overview
The overall structure of the Moses model is illustrated in Figure 1. The model is currently expressed as ten distinct functions which are in turn combined into three module groups – demographic transitions, migration and housing. Before commenting on these three module groups, a number of preliminary observations concerning the model are necessary.
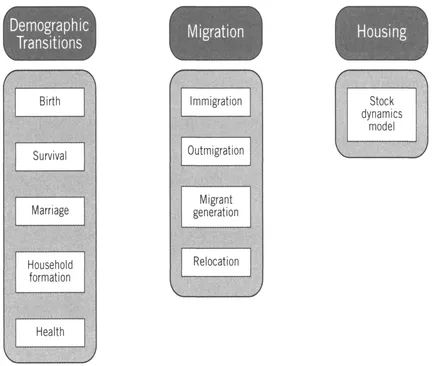
Figure 1: The structure of the Moses dynamic model
The Moses dynamic model builds on a baseline simulation or Population Reconstruction Model (PRM) which recreates the entire UK population as an array of households and their constituent members (Birkin et al., 2006). Both private households and communal establishments are represented. The PRM uses synthetic records from the 2001 Census Sample of Anonymised Records (SAR) which provides quite an extensive array of social and demographic characteristics for each household. The base population is constructed using a genetic algorithm which reweights the SAR to local neighbourhood profiles from the Census Small Area Statistics. The algorithm has been shown to perform well. For the purpose of the dynamic model prototype which is reported here, a subset of important household and individual characteristics are extracted from the PRM. The household characteristics are location, housing type and household size. The individual characteristics are age, sex, marital status, social class, ethnicity and health. Each of these individual and household attributes is projected throughout the course of the simulation.
The spatial units adopted within the model are census wards, of which there are more than 11,000 in England, although only 33 in the Leeds Metropolitan District, which is used as the exemplar throughout the chapter. The simulation operates in discrete time intervals of one year, and runs from a base year of 2001 until 2031.
The order in which the various demographic modules are implemented is also worthy of further discussion. Van Imhoff and Post (1998: 116-117) note four alternative procedures involving simultaneous implementation, versus sequential implementation with a fixed order of events, a random order of events, or one in which the most likely event is itself simulated for each individual. In this application, a fixed order of events has been implemented in the sequence shown in Figure 1. There is some logic to the ordering – for example, the demographic transitions come before migration, because if there is a spatial dependence (e.g.mortality rates depend on the place of residence) then this is more likely to be historically embedded than newly acquired. Nevertheless it is recognized that the sequence is to some degree arbitrary, and that some further investigation of alternatives might be justified at some point ...
Table of contents
- Cover
- Half Title
- Title
- Copyright
- Contents
- List of Figures and Tables
- Preface – Orcutt's Vision 50 Years On
- Part I: Spatial Modelling
- Part II: Work Incentives and Labour Supply
- Part III: Demographic Issues, Social Security and Retirement Incomes
- Part IV: Macro-Micro Linkages and Environmental Policies
- List of Contributors
Frequently asked questions
Yes, you can cancel anytime from the Subscription tab in your account settings on the Perlego website. Your subscription will stay active until the end of your current billing period. Learn how to cancel your subscription
No, books cannot be downloaded as external files, such as PDFs, for use outside of Perlego. However, you can download books within the Perlego app for offline reading on mobile or tablet. Learn how to download books offline
Perlego offers two plans: Essential and Complete
- Essential is ideal for learners and professionals who enjoy exploring a wide range of subjects. Access the Essential Library with 800,000+ trusted titles and best-sellers across business, personal growth, and the humanities. Includes unlimited reading time and Standard Read Aloud voice.
- Complete: Perfect for advanced learners and researchers needing full, unrestricted access. Unlock 1.5M+ books across hundreds of subjects, including academic and specialized titles. The Complete Plan also includes advanced features like Premium Read Aloud and Research Assistant.
We are an online textbook subscription service, where you can get access to an entire online library for less than the price of a single book per month. With over 1.5 million books across 990+ topics, we’ve got you covered! Learn about our mission
Look out for the read-aloud symbol on your next book to see if you can listen to it. The read-aloud tool reads text aloud for you, highlighting the text as it is being read. You can pause it, speed it up and slow it down. Learn more about Read Aloud
Yes! You can use the Perlego app on both iOS and Android devices to read anytime, anywhere — even offline. Perfect for commutes or when you’re on the go.
Please note we cannot support devices running on iOS 13 and Android 7 or earlier. Learn more about using the app
Please note we cannot support devices running on iOS 13 and Android 7 or earlier. Learn more about using the app
Yes, you can access New Frontiers in Microsimulation Modelling by Ann Harding in PDF and/or ePUB format, as well as other popular books in Social Sciences & Anthropology. We have over 1.5 million books available in our catalogue for you to explore.