This title was first published in 2001. Forecasting is an essential discipline in the planning and running of a business: not only for the business plan and annual budget but for the appraisal of investment projects, the commissioning of research as well as the appraisal of the competition and the feasibility of making acquisitions. Managers are continually confronted with the need to take decisions, and being able to construct a route map of the future is a key way of determining a course of action. This book offers a practical guide to forecasting the environment in which a firm operates. The author goes through the key areas which can affect a business. He includes those which are out of the firm's control such as fiscal and monetary policy, population levels and the labour market; and those that are, such as costs, prices, profits and product development.

- 224 pages
- English
- ePUB (mobile friendly)
- Available on iOS & Android
eBook - ePub
About this book
Trusted by 375,005 students
Access to over 1.5 million titles for a fair monthly price.
Study more efficiently using our study tools.
Information
PART 1
BEYOND THE FIRM’S CONTROL
1 | FORECASTING THE NATIONAL ECONOMY |
Most business forecasts are derived from a forecast of the national economy. A forecast of a particular domestic market or an industry, has to take account of the changes in national spending power and output. This does not mean that the firm has to construct a detailed forecast of the national economy.
There are large numbers of forecasts made by banks, stockbrokers and forecasting institutions and it is possible to use one of these to provide a background forecast for the firm’s specific needs. It is essential, however, for the firm’s forecaster to check the assumptions used in the national forecast. It is not difficult to vary some of the assumptions and to modify the statistical picture of the whole economy.
Consensus forecasts are also available, built up from a large number of national forecasts. These, however, must be treated with caution since there are no consensus assumptions and it is not possible to amend the consensus figures for a variation in assumptions. The consensus forecast may show high and low figures for the various components of the forecast and these may give some clue as to the degree of certainty and uncertainty of the different features.
In order to understand forecasting techniques it is necessary to analyse the construction of the national income accounts and how the economy works.
The measurement of national product
The product of the economy can be measured in three ways: first, by summing all the incomes of the community; second, by summing all the spending of the community; and third, by summing the value of the output. By definition the three measures of product must be equal. This is because all income is either spent or saved; and savings are also spent in one way or another by the body which uses the savings. Thus the total of spending on both goods and services for current consumption, and on capital investment in fixed assets and stocks, must be equal to total income.
Similarly, output gives rise to income, in the form either of wages and salaries or of profits. Profits are as much a form of income as wages and salaries and are either distributed in the form of interest and dividends or else retained as business savings. The fact remains, however, that output has a revenue value which is equal to the income it generates. Therefore output must also equal incomes.Thus, for purposes of measurement and estimation of the national product and national income, incomes = spending = output.
This sequence is illustrated in Diagram 1.1. It will be seen that at each point of time income, spending and output are equal. It will also be seen that income leads to spending and spending generates output. The diagram also illustrates the role of stocks, since spending will first affect the level of stocks held in the retailers’ hands. Changes at the retail level will result in new orders directly, or through wholesalers, to factories and this in turn will generate orders for new production.
Diagram 1.1 National product flows
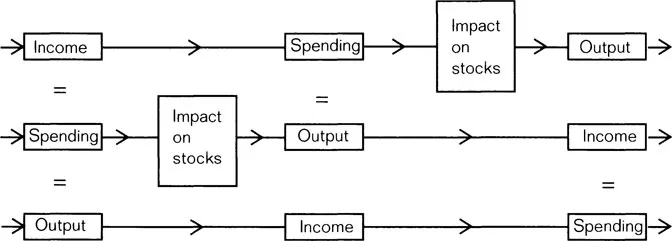
Diagram 1.2 National product growth spiral
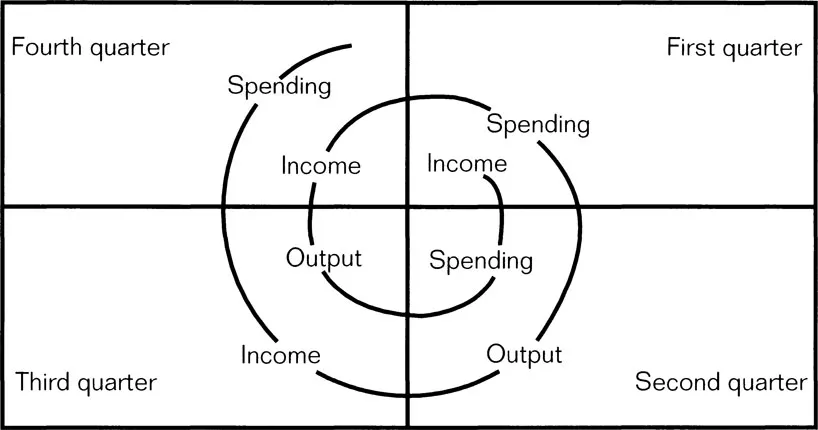
The sequence is further illustrated in Diagram 1.2, using the simple assumption that there are time lags of roughly three months between changes in income and changes in spending and then intervals of three months between changes in spending and changes in output. It will be seen that the sequence can be thought of as a spiral. In a growing economy, the cycle of cause and effect, moving through income to spending to output, will result in income in the second round being higher than in the first round. Although it is difficult to illustrate the process diagrammatically, the chart of the spiral could be enlarged to show three simultaneous spirals with the income spending and output factors being equal at each point in time.
The first stage in forecasting, therefore, has to be the construction of a consistent set of estimates of data for the past. This is a problem which has received far too little analytical attention in all countries. It is regrettable to find that considerable research resources are devoted to exploring relationships between the economic sectors instead of giving priority to the improvement of the statistical raw material. Analysts tend to be dazzled by figures and frequently overlook the poor quality of the statistics they manipulate. In many cases fine research is unjustified because of the crudeness of the available data.
The National Income Accounts show estimates of the broad measures of product broken down into considerable detail. The forecaster then has to marshal the statistics in such a way as to draw out the sequence of cause and effect and to trace changes throughout the whole system.
Money flows
The simple concept of incomes generating spending and then production via an impact on stocks must also be seen in relation to the stock and flow of money.
Organizations and individuals hold money in the form of both bank accounts and cash, bank deposits being by far and away the more important. Spending decisions depend not only on the receipt of income but also on cash in hand and at bank and expectations of income in the future. A convenient way to think about income and spending is that incomes ‘top up’ the individual’s (or organization’s) stock of cash before it is depleted by spending.
A simplified illustration of the concept of stock and flows of money is shown in Diagram 1.3. Moving from output (bottom left) through to incomes in the form of wages and profits, tax is then paid over to the government. What is left is ‘disposable’ income, available for spending.
In fact the incomes after tax are added to the money stock and individuals (and businesses) spend out of their replenished money stock. Part of the disposable incomes will be saved and in the first instance the savings swell the money stocks. In practice, businesses and individuals spend not only on consumer goods but also on capital goods, and the money stock will be depleted by capital spending.
Diagram 1.3 Government and the economy
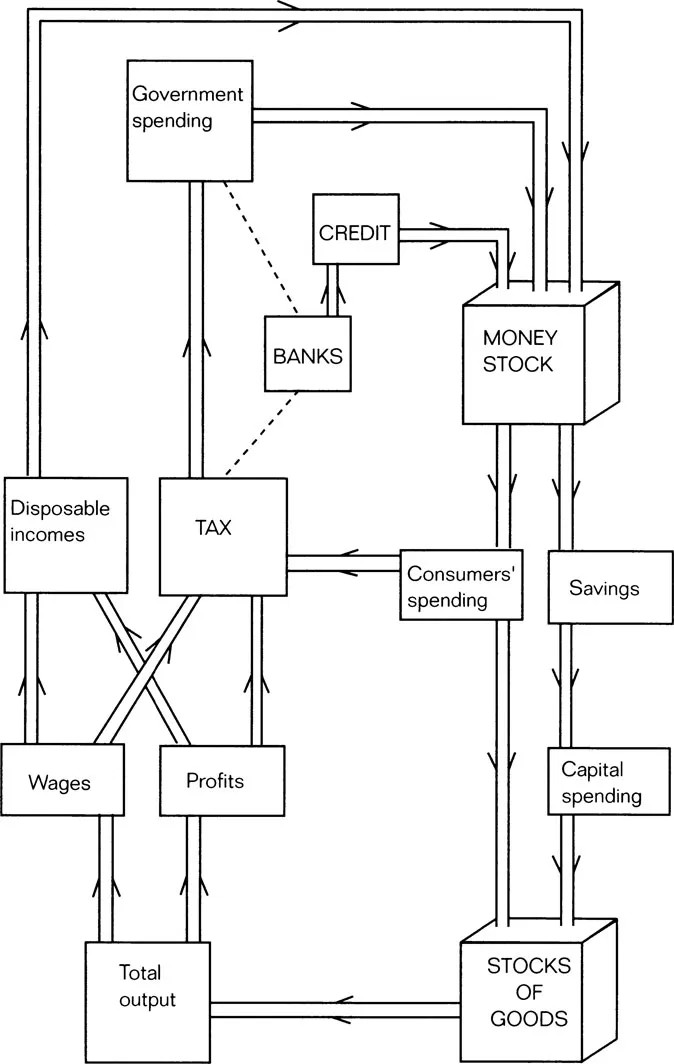
Spending then makes its impact on the stock of goods, before making an impact via orders for new production. Total output includes capital goods as well as consumer products and services. Spending on services, of course, is not ‘intercepted’ by stocks. A haircut is performed on the spot.
Thus the money goes round and round and economic life proceeds in an unchanging way. How, then, do things change? There are five main factors to take into account, namely, government policy and its impact on incomes and spending; government financing and its impact on the banking system; monetary policy; imports and exports and transactions with the outside world; and finally, technical changes, altering the way things are produced and the way people live.
Government fiscal policy
Government takes money away from the public by way of taxation. The money is put back via government spending. Increases in taxation and decreases in government spending reduce the public’s spending power; the opposite policy changes increase spending power. In practice, governments (like businesses) nearly always run a surplus on current account; that is, government revenues exceed public authorities’ current account spending on goods and services, the principal items being education, defence and health.
The surplus on current account is nearly always insufficient to finance public sector capital spending. The deficits have to be financed by borrowing. In practice, an increase in the deficit means more money is being added to the private sector’s bank balance and a decrease results in a smaller addition to private bank balances and spending capacity
Monetary policy
Public sector deficits are financed by two forms of borrowing: by tapping private savings by selling government bonds and by borrowing from the banking system via the issue of Treasury Bills (three-month IOUs).
When the financial institutions and other private bodies buy bonds they in effect hand back to the government part of the money pushed out as a result of the public sector overall deficit. When the banks lend the government money via purchases of Treasury Bills their ability to lend is not diminished because Treasury Bills rank as near cash in banks’ balance sheets. Thus, whereas the government gets the use of the money it has borrowed via Treasury Bills, the banks’ (and general public’s) cash resources are undiminished.
Part of the shortfall is also met by issuing new notes and coin, but increases in cash in circulation generally contribute a minor part in financing an increase in the money supply.
One of the basic rules of banking is that ‘every advance creates its own deposit’. This is because an overdraft facility leads the borrower to draw cheques which make their way into other bank accounts. Other banks’ deposit levels therefore rise and the banks are in turn able to lend more. The net result is a rise in deposits overall, tending to match the initial increase in bank advances. Thus an increase in the money supply, resulting from government deficit financing, will tend to be increased still further by extra bank lending, providing the banks are willing to lend and the general public willing to borrow.
Expansion of credit can, of course, be controlled or neutralized by the authorities. Special deposits or forced loans from the banks can be employed to ‘mop up’ surplus funds from the banks. In addition, direct controls can be applied to bank lending, either rationing credit or creating special classes of borrowers.
The authorities can also borrow abroad, or foreigners may bring extra funds into (or take funds out of) the country, thus influencing the money supply (discussed below).
Interest rates are the ‘price’ of money. Extra money in relation to the demand for funds will tend to reduce interest rates and vice versa. If the authorities wish to manipulate interest rates it is necessary to allow the money supply to change in relation to the demand for funds. Thus, if interest rates are fixed, money supply will need to fluctuate; if money supply is fixed then interest rates will need to fluctuate.
The outside world
Imports and exports of goods and services seldom balance out. The net of these items is usually the biggest feature in the balance of payments. Other current payments, in and out, of such things as interest, dividends, foreign aid and emigrants’ remittances, together with the trade balance, make up the balance of payments on current account.
Capital movements comprising business investment in both directions, portfolio investment, government capital transactions and movements of working capital and money on deposit, form the balance of payments on capital account. Taken with the current account, the overall balance of payments is a measure of funds moving into or out of the country.
These movements may add to, or reduce, the country’s official reserves of gold and foreign exchange or may partly be reflected in exchange rate movements. If the authorities determine to hold exchange rates steady then they are obliged to sell foreign exchange from the reserves when the overall payments position is in deficit, and vice versa. If they are not prepared to use the reserves then the price of the currency against other currencies has to be allowed to rise or fall to the point where the supply and demand equate. This implies a change in the capital account movement on the balance of payments.
Transactions with the rest of the world have an obvious impact on the home economy. A rise in exports means more business and production for the home economy. A rise in imports can occur at the expense of the home economy. These movements, as well as the capital and money movements, can produce changes in the home economy in much the same way as changes in government fiscal and monetary policy will make a direct impact on home incomes, spending and output.
Technical changes
Finally, a new invention, new ways of doing things and new products will make an impact on the economy. The ‘static’ cycle shown in Diagram 1.1, of incomes, spending and production, round to incomes again, can change in a dynamic way if ‘better’ ways of doing things are introduced, resulting in more output for the same effort.
An economy can grow, therefore, as a result of technical innovation, though it will generally be the case that more spending power will need to be injected into the system to enable this to happen.
Social and political changes
Dynamic change also occurs in the economy as a result of social and political pressures. Social attitudes and family behaviour are constantly changing, for the most part gradually. These changes will be reflected, not only in how people spend their money but in the way they work. Working hours and holidays change and trade unions exert pressures which are reflected both at work and at the political level.
In a democracy governments are subject to powerful political pressures. The tendencies are for existing public services to be maintained and expanded and for new services to be introduced. This tendency towards expansion of the social and welfare services is interrupted from time to time, and sometimes reversed, owing to a clash of interests and res...
Table of contents
- Cover
- Half Title
- Title Page
- Copyright Page
- Table of Contents
- List of diagrams
- List of tables
- Foreword by Robert Heller
- Introduction: the role of forecasting
- PART 1 BEYOND THE FIRM’S CONTROL
- PART 2 UNDER THE FIRM’S CONTROL
- Bibliography
- Index
Frequently asked questions
Yes, you can cancel anytime from the Subscription tab in your account settings on the Perlego website. Your subscription will stay active until the end of your current billing period. Learn how to cancel your subscription
No, books cannot be downloaded as external files, such as PDFs, for use outside of Perlego. However, you can download books within the Perlego app for offline reading on mobile or tablet. Learn how to download books offline
Perlego offers two plans: Essential and Complete
- Essential is ideal for learners and professionals who enjoy exploring a wide range of subjects. Access the Essential Library with 800,000+ trusted titles and best-sellers across business, personal growth, and the humanities. Includes unlimited reading time and Standard Read Aloud voice.
- Complete: Perfect for advanced learners and researchers needing full, unrestricted access. Unlock 1.5M+ books across hundreds of subjects, including academic and specialized titles. The Complete Plan also includes advanced features like Premium Read Aloud and Research Assistant.
We are an online textbook subscription service, where you can get access to an entire online library for less than the price of a single book per month. With over 1.5 million books across 990+ topics, we’ve got you covered! Learn about our mission
Look out for the read-aloud symbol on your next book to see if you can listen to it. The read-aloud tool reads text aloud for you, highlighting the text as it is being read. You can pause it, speed it up and slow it down. Learn more about Read Aloud
Yes! You can use the Perlego app on both iOS and Android devices to read anytime, anywhere — even offline. Perfect for commutes or when you’re on the go.
Please note we cannot support devices running on iOS 13 and Android 7 or earlier. Learn more about using the app
Please note we cannot support devices running on iOS 13 and Android 7 or earlier. Learn more about using the app
Yes, you can access How to Forecast: A Guide for Business by James Morrell in PDF and/or ePUB format, as well as other popular books in Social Sciences & Sociology. We have over 1.5 million books available in our catalogue for you to explore.