A solution to the climate and energy crisis The reversible fuel cell (RFC) described in this volume stores solar energy and thereby makes it continuously available. This can make the building of energy-free homes and all electric transportation a reality. The foldout drawing at the back of this book also describes the detailed design of the world's first 1,000 megawatt solar-hydrogen power plant.
How is this possible?Our planet receives more solar energy in an hour than humans use in a year. In fact, 5% of the Sahara could meet the total energy requirement of mankind. This energy can then be stored and transported in the form of hydrogen.
Converting from an exhaustible energy economy to a clean, free, and inexhaustible one In this timely book, author Béla Lipták explains why a solar-hydrogen economy is technically feasible and cost-effective. He first outlines existing conservation technologies and renewable energy processes as well as evolving technologies, such as energy-free homes, roof shingle solar collectors, and RFCs. He goes on to discuss energy optimization techniques that could reduce the global energy consumption by one third and finally presents the detailed design of a full size solar-hydrogen power plant.
It is time to harness the power of solar energy With global energy consumption quadrupling in the last fifty years and atmospheric carbon dioxide reaching the highest level ever recorded, now is the time to prevent further damage to the planet and ensure the survival of human civilization. It is debatable how much time we have before our fossil and uranium deposits are exhausted. It is also debatable how much climate change we can live with or how much of our economic resources should be devoted to stabilizing and reversing mankind's growing carbon footprint. What is not debatable is that our resources are exhaustible and that we must not give reason for our grandchildren to ask, "Why did you not act in time?".
Trusted by 375,005 students
Access to over 1.5 million titles for a fair monthly price.
During the last 100 years, we have created a global warming time bomb while nearly exhausting our energy reserves. The population of the planet and the global energy consumption both quadrupled, and the global gross world product (GWP) increased sixfold. We treat the atmosphere, the rivers, and the ocean as “open sewers” while consuming 5.5 billion tons of coal, 33 billion barrels of oil, and 100 trillion cubic foot of natural gas every year. The total yearly electricity consumption is 15 trillion kWh and that is also estimated to triple during the next 50 years. While nuclear warheads will not increase our energy reserves, there are enough in storage to destroy the planet 25 times over, and now the arms race is also expanding into space. In 2008 the total global GWP was about $68 billion, the GDP (gross domestic product) of the United States was about $15 trillion and her military budget for 2009 exceeds that for Social Security. The public believes that the main problems we face are the economy and the wars without realizing that both are the result of the energy crisis.
This trend of increasing population and per capita consumption of energy and other resources is approaching the “tipping point.” The climate-driven disruption of food, water, and land resources is threatening stability by causing mass migration, disease, and malnutrition. Islands and coastal regions face flooding and hurricane damage. Changing rainfall patterns are turning the semiarid regions of the planet into arid ones, the melting of glaciers threatens drastic reductions in the water supplies of vast areas, including India and China, and even the fishing rate of the oceans has exceeded the sustainable limit. We are racing toward self-destruction like a car with its gas pedal floored and stuck.
Today the per capita yearly energy use on the planet ranges from 1,000 kWh/yr in Africa to 16,000 kWh/yr in North America. These numbers alone should convince us that the advanced industrial nations have not only the need, but also the duty to correct the damage they have done and the only way to do that is to implement clean and inexhaustible energy technologies.
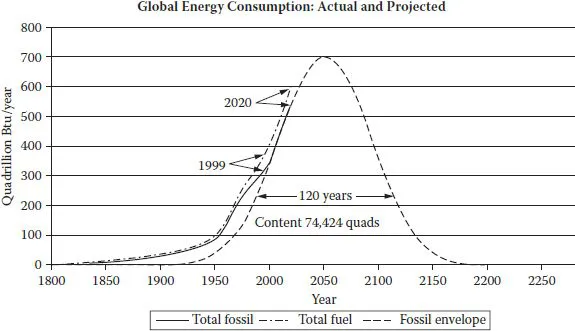
FIGURE 1.1 Availability of the known fossil fuel reserves. (From NASA, 1999.)
My reason for writing this book is to show that the future does not need to be bleak, that we can overcome this planetary emergency. We do have both a free energy source and the know-how to convert today’s oil-based economy into an economical, clean, and inexhaustible one in the future.
1.1.1Global Energy Reserves and Trends
The time for holding conferences and writing articles is over. The Secretary General of the United Nations, on September 24, 2007, put it this way: “The time for doubt has passed.” It is time to build those demonstration plants that will clearly establish the feasibility and costs of the various alternative energy systems. It is time to start to replace fossil fuels with clean and renewable energy sources such as solar–hydrogen.
Figure 1.1 shows the global fossil energy resources and the rate at which they are being consumed.
When discussing global energy consumption, the unit of energy most often used is the quad (Q). One Q equals 1 quadrillion Btu (1015 Btu), 1.055 exajoules (EJ), 172 million barrels of oil equivalent (boe), or 0.293 petawatt hour (pWh = 1012 kWh)* of electricity. One Q is also equivalent to the yearly energy produced by over two dozen nuclear power plants, the energy content of 10,000 supertankers of oil, 400,000 railcars of coal, or 28 billion cubic meters of natural gas.
As shown in Figure 1.1, the total fossil fuel reserves of the globe are estimated to be about 75,000 Q, and the total energy consumption is rising at a rate higher* than the supply of fossil fuels. The difference between the curves is being met from nuclear and renewable energy sources. The fossil envelope (dotted line) describes the likely future consumption of fossil energy (coal, oil, and natural gas). The area under this curve is the total of the known fossil reserves on the planet.
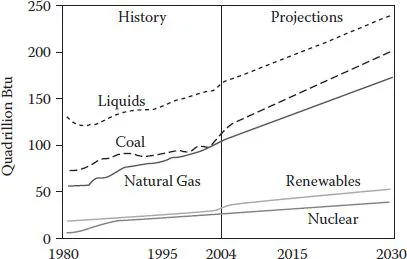
FIGURE 1.2 World marketed energy use by fuel type, 1980–2030. (From Energy Information Administration (EIA), International Energy Annual 2004 (May–July 2006), http://www.eia.doe.gov/iea. Projections: EIA, System for the Analysis of Global Energy Markets (2007).)
The curve projects a maximum yearly fossil fuel production capability of about 700 Q, which could be reached by 2050. It also projects the total exhaustion of the fossil energy supply by the year 2200. Besides being exhaustible, the burning of fossil fuels also releases carbon dioxide (CO2) into the atmosphere. In spite of these facts, the global dependence on fossil fuels is projected to increase (Figure 1.2).
The global energy consumption during the half-century 1950–2000 increased from 100 to 400 Q. Today, it is about 450 Q and is rising at a rate of about 15 Q/yr. It is expected to reach 600 Q by the year 2020. The present energy consumption of the United States is about 100 Q. The global and domestic energy needs are being met mostly by fossil and nuclear sources (Table 1.3).
1.1.2Traditional Energy Sources and Costs
As shown in Table 1.3, nearly 90% of the global energy demand is met by fossil and nuclear sources. Of these sources, nuclear is unsafe, fossil is polluting, and both are exhaustible. The costs of all forms of fossil fuels increased drastically during the last 5 years. In early 2008 the wholesale price of a million Btus of energy in the form of coal was about $6, in natural gas about $10, and in the form of oil about $30. On the average, power plants pay about 80% of the commercial prices while residents pay from 150% to over 200%.
TABLE 1.3
Global and Domestic Energy Sources
Energy Sources
Global (%)
United States (%)
Oil
35–37
39–40
Coal
25–26
23–24
Natural gas
20–25
21–24
Wood and biomass
9–10
*
Nuclear
7.5
8
Hydroelectric
2.4
7
Solar
0.6
a
Geothermal
0.4
a
Wind
0.05
a
* The combined total of these three sources is about 2.5% and is included in the 7% listed for hydroelectric.
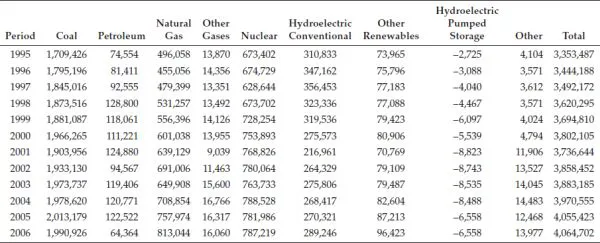
Table 1.4 lists the types of electric power plants and their shares in the total production of electricity in the United States. The total energy consumption of the United States is about 100 Q, of which industry consumes 32.5%, transportation 28%, residents 21%, and commerce 18%. Of the total energy consumption, about 15 Q is used in the form of electricity.
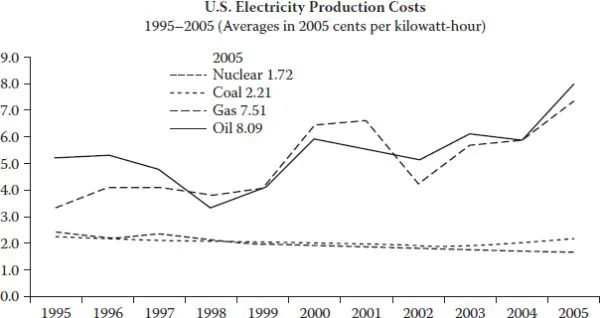
One of the reasons for the present energy crisis is that powerful business interests are trying to extend the use of fossil and nuclear power. Figure 1.5 describes (according to the Nuclear Energy Institute) the cost of electric power generation in the United States during the decade 1995–2005. One might observe that nuclear and coal costs are shown as being the lowest, and hydroelectric and wind power costs are not listed at all. It should also be noted that although the Nuclear Energy Institute shows the coal and nuclear electricity generation cost at about 2.0¢/kWh. This has changed drastically in the last couple of years, because the cost of both uranium and of all fossil fuels at least doubled. For example, in the spring of 2008 the wholesale price of a metric ton of coal was around $140, while in 2003 it was $25. Similarly, the cost of a kilogram of uranium increased from $10 to $75 during the last decade. Therefore, such data as provided by the Nuclear Energy Institute in Figure 1.5 is totally misleading. The reality is that by the time electricity reaches a household, it is 10 times that shown in Figure 1.5 for nuclear (in 2007 in Connecticut, we paid about 18¢ for a kilowatt hour of electricity).
Another major problem with the global electricity system is the lack of continent-wide electric grids that could serve both to distribute and to store electricity. This “net metering” capability (Section 1.4.3.1) is essential to make the energy of intermittent energy sources (solar, wind, tide, etc.) continuously available.
TABLE 1.4
Total Electricity Generation in the United States, by Energy Source and Type of Producer, 1995–2006 (1000 mWh)
Source: Energy Information Administration (EIA).
FIGURE 1.5 Electricity production costs during the decade of 1995–2005. (From the Nuclear Energy Institute.)
The actual average wholesale cost of 1 kWh of electricity in 2007 in the United States (in cents), as a function of fuel used to generate it (according to the New York Times, July 11, 2007) was as follows:
Pulverized coal
5.7
Nuclear
6.4
Coal gas
6.6
Natural gas
7.3
Wind
9.6
Biomass
10.7
Solar thermal
12.0
If a $50/ton carbon emission charge is mandated, renewable energy cost would become more competitive as follows:
Nuclear
6.4
Natural gas
9.2
Wind
9.6
Pulverized coal
10.1
Coal gas
10.8
Biomass
11.2
Solar thermal
12.0
Therefore there are generation costs (Figure 1.5), wholesale costs (above), and transpor...
Table of contents
Cover
Half Title
Title Page
Copyright Page
Dedication
Table of Contents
The Author
Introduction
1 The Case for Renewable Energy Processes
2 Control and Optimization of Energy Conservation and Renewable Energy Processes
3 Sensors and Analyzers for Renewable Energy Processes
4 The Design of the World’s First Full-Size Solar–Hydrogen Demonstration Power Plant
5 Conclusions
Abbreviations
Index
Frequently asked questions
Yes, you can cancel anytime from the Subscription tab in your account settings on the Perlego website. Your subscription will stay active until the end of your current billing period. Learn how to cancel your subscription
No, books cannot be downloaded as external files, such as PDFs, for use outside of Perlego. However, you can download books within the Perlego app for offline reading on mobile or tablet. Learn how to download books offline
Perlego offers two plans: Essential and Complete
Essential is ideal for learners and professionals who enjoy exploring a wide range of subjects. Access the Essential Library with 800,000+ trusted titles and best-sellers across business, personal growth, and the humanities. Includes unlimited reading time and Standard Read Aloud voice.
Complete: Perfect for advanced learners and researchers needing full, unrestricted access. Unlock 1.5M+ books across hundreds of subjects, including academic and specialized titles. The Complete Plan also includes advanced features like Premium Read Aloud and Research Assistant.
Both plans are available with monthly, semester, or annual billing cycles.
We are an online textbook subscription service, where you can get access to an entire online library for less than the price of a single book per month. With over 1.5 million books across 990+ topics, we’ve got you covered! Learn about our mission
Look out for the read-aloud symbol on your next book to see if you can listen to it. The read-aloud tool reads text aloud for you, highlighting the text as it is being read. You can pause it, speed it up and slow it down. Learn more about Read Aloud
Yes! You can use the Perlego app on both iOS and Android devices to read anytime, anywhere — even offline. Perfect for commutes or when you’re on the go. Please note we cannot support devices running on iOS 13 and Android 7 or earlier. Learn more about using the app
Yes, you can access Post-Oil Energy Technology by Bela G. Liptak in PDF and/or ePUB format, as well as other popular books in Technologie et ingénierie & Énergie. We have over 1.5 million books available in our catalogue for you to explore.