First published in 1998, Ruggeri and Vincent analyse different tax reform proposals to create a discourse on dispelling the myths surrounding the flat tax. This book proposes a progressive and comprehensive tax reforms, whilst simplifying the tax system for the vast majority of tax payers. Whilst ensuring the tax system reforms dose not hinder economic growth. This book should be required reading for anyone interested in the problems and promise of tax reform.
- 20 pages
- English
- ePUB (mobile friendly)
- Available on iOS & Android
eBook - ePub
An Economic Analysis of Income Tax Reforms
Part I
The Canadian Tax System:
A Brief Overview
1 Dimensions of the Canadian Tax System
Although the economic analysis of income tax reforms contained in this book applies to any country which uses the personal income tax as a major revenue source, we have selected Canada as a test case. Therefore, it may be useful to provide some background on the Canadian tax system before discussing various personal income tax reform proposals. In this chapter, we first place the Canadian tax system within an international context by comparing it to that of a number of selected industrialised countries. Second, we show how the taxing powers are divided among federal, provincial and local governments. Then we describe the main elements of the personal income tax system. Finally, we present a classification of the different components of the tax system which provides a conceptual framework for the current debate on income tax reform.
International Context
The tax systems of different countries are often compared by showing the ratio of the revenue they generate in a given year to the total value of output produced in the same year, measured by Gross Domestic Product (GDP). This is the main approach used by the Organization for Economic Co-operation and Development (OECD) and the comparative revenue statistics that it publishes annually are used in this section.
Table 1.1 shows the ratio of tax revenue to GDP for 16 OECD countries in 1994. When social security revenues are included in the total, the 16 countries can be divided into three groups in terms of their revenue to GDP ratios: those with ratios above 40 percent, those with ratios between 30 percent and 40 percent, and those with ratios below 30 percent.
We notice that seven of the 16 countries are in the top revenue to GDP ratio category. They are all European countries and are led by Denmark and Sweden with ratios around 50 percent. The average ratio for the European Community and for the European component of the OECD is also above 40 percent. Canada is one of seven countries in the middle group together with Germany and the United Kingdom. However, Canada’s revenue to GDP ratio at 37.2 percent is below the OECD average of 37.4 percent. The U.S. and Japan are the only countries with ratios below 30 percent. Out of the 16 countries in our sample, 9 have higher revenue to GDP ratios than Canada.
When social security is excluded, only Denmark remains with a ratio in excess of 40 percent. The group of countries with ratios between 30 percent and 40 percent is reduced to five (Sweden, New Zealand, Norway, Belgium and Canada). Canada’s ratio of 31.0 percent is higher than the ratio for the OECD countries (27.6 percent), the European component of the OECD countries (28.6 percent) and the European Community (29.6 percent).
Table 1.1
Tax Revenue as a Percent of Gross Domestic Product (GDP) in Selected Organization for Economic Co-operation and Development (OECD) Countries, 1995
Tax Revenue as a Percent of Gross Domestic Product (GDP) in Selected Organization for Economic Co-operation and Development (OECD) Countries, 1995
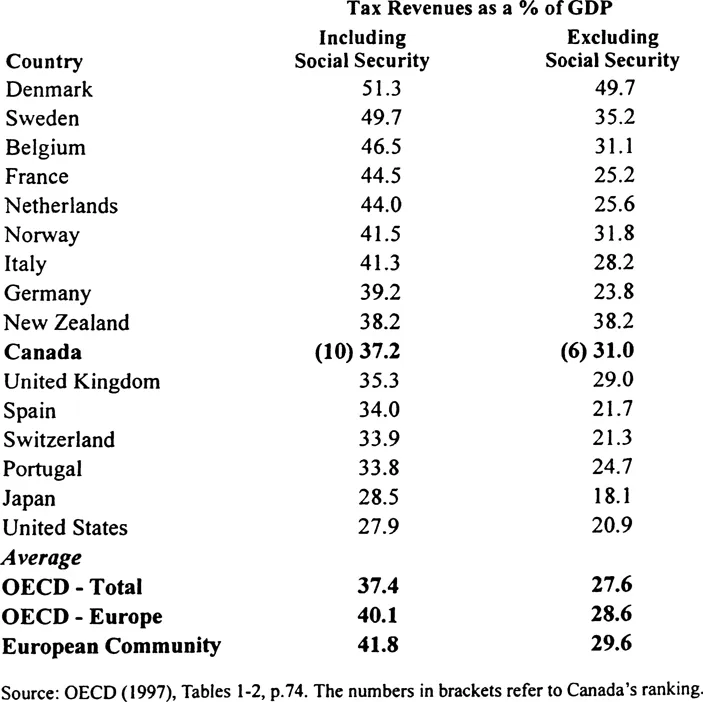
Table 1.2
Tax Revenue by Major Revenue Sources as a Percentage of Gross Domestic Product (GDP) in Selected OECD Countries, 1995
Tax Revenue by Major Revenue Sources as a Percentage of Gross Domestic Product (GDP) in Selected OECD Countries, 1995
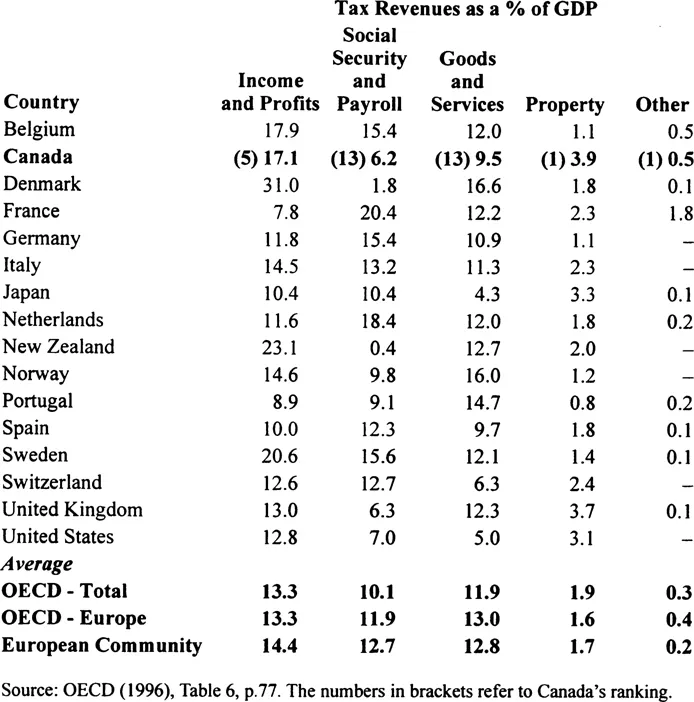
A breakdown of the aggregate tax revenue to GDP ratio is contained in Table 1.2. It shows that the ratio for Canada is above average for the combination of income and profit taxes and for property taxes and below average for the other major taxes. In Canada, all governments collected in 1995, on average and in relation to GDP, 17 cents out of each dollar of GDP in the form of income and profit taxes and an additional 6 cents in the form of taxes on wages. They also collected 9.5 cents out of one dollar of GDP when income was spent and an additional 4.4 cents from property and other taxes.
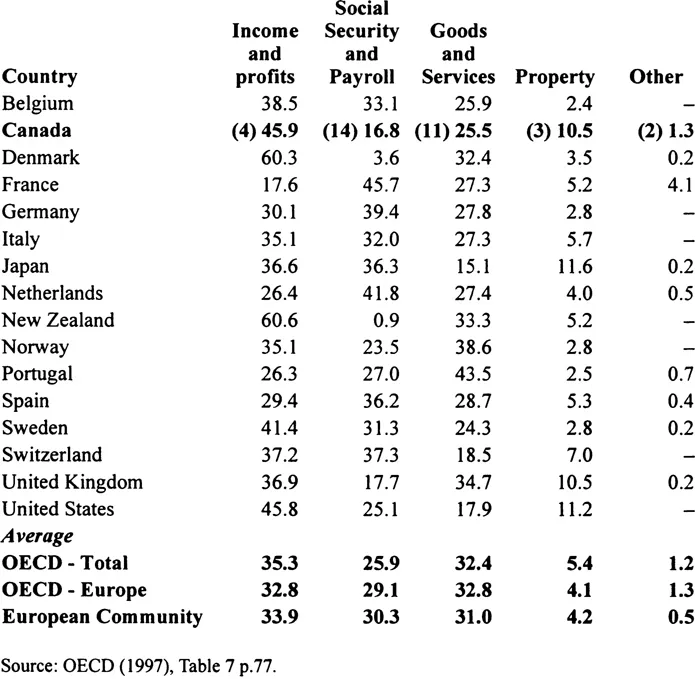
Table 1.3 provides a brief comparison of the tax mix in the same 16 countries. The largest share of revenue, on the average, is generated by income taxes, both personal and corporate. However, there is wide variation among countries. At the top end are Denmark and New Zealand with about 60 percent of total tax revenue generated by income and profits taxes. Canada, Sweden and the U.S. collect somewhat over 40 percent of total revenue from income taxes. In the European Community and the OECD countries income taxes account for about one-third of total revenue.
In the OECD countries, an additional 30 percent of revenue, on the average, is generated by consumption taxes. Eleven of the 16 countries, including Canada, have consumption tax shares below 30 percent. Only Portugal has a share greater than 40 percent. Canada’s share at 25.5 percent is lower than the OECD average (32.4 percent) and the average for the European Community (31.0 percent).
There is substantial variation in the share of social security and payroll taxes among the selected 16 countries. France has the highest ratio at 45.7 percent, followed by the Netherlands with 41.8 percent. Seven countries have shares between 30 and 40 percent. Three countries, including the U.S., have shares between 20 and 30 percent. Canada, with a share of 16.8 percent, is part of a group of four countries, which includes the U.K., with relatively low reliance on social security and payroll taxes.
Only four countries - Canada, Japan, the U.K. and the U.S. - place a relatively high reliance on real property taxes. All other countries receive less than 8 percent of their revenue from property taxes.
When compared to the OECD or the European Community, Canada’s tax mix relies relatively more on income taxes than on consumption taxes or social security and payroll taxes. Compared to the U.S., Canada relies equally on income taxes, substantially more on consumption taxes and substantially less on social security and payroll taxes. The main difference between the U.S. and Canadian tax mix is in the relative importance of consumption taxes and social security plus payroll taxes. Since, under certain conditions,1 payroll taxes are equivalent to consumption taxes, from an economic perspective the difference in the tax mix between Canada and the U.S. may be less than it appears at first blush.
Table 1.3
Tax Revenue by Major Revenue Source as Percent of Total Tax Revenue in Selected OECD Countries, 1994
Tax Revenue by Major Revenue Source as Percent of Total Tax Revenue in Selected OECD Countries, 1994
Federal-Provincial-Local Dimensions
In Canada, local governments are offsprings of the provinces, but the federal and provincial government are creatures of the Constitution. Local governments can exercise only the taxing powers which are granted to them by the provinces. Federal and provincial governments have constitutional taxing powers which cannot be altered by legislation. The federal government has broad powers of taxation, but cannot impose royalties on provincial natural resources. Provincial governments are generally limited to the imposition of direct taxes, and can use indirect taxes only in selected areas of natural resources. In practice, this limitation to direct taxation has not imposed constraints on provincial governments. Property taxes are considered direct taxes and consumption taxes can be given the direct tax form through the device of legally imposing the tax on the consumer or purchaser. As a result, when we look at the data on tax revenue for the federal and provincial governments we notice that all tax fields – except for custom duties, which are constitutionally an exclusively federal revenue source, and real property taxes, which are mostly a local revenue source by tradition – are jointly occupied.
Some information on the relative occupancy of the various tax fields by level of government is provided in Table 1.4. In this table, we excluded from the revenue sources contributions to the Canada/Québec Pension Plan for two reasons. First, these social security taxes can be viewed as user fees, as they involve payments generating an entitlement to benefits directly related to contributions. Second, the federal-provincial breakdown would not be very meaningful when only one province (Québec) is included and its program is virtually identical to the federal one.
Starting from the aggregate of ail taxes, Table 1.4 shows that the federal government and provincial-local governments combined collect almost equal shares of tax revenue. The federal government accounts for nearly half of the total, provincial governments for about 40 percent and local governments collect the remaining 10 percent.
Table 1.4
Tax Revenue by Level of Government in Canada, 1995
Tax Revenue by Level of Government in Canada, 1995
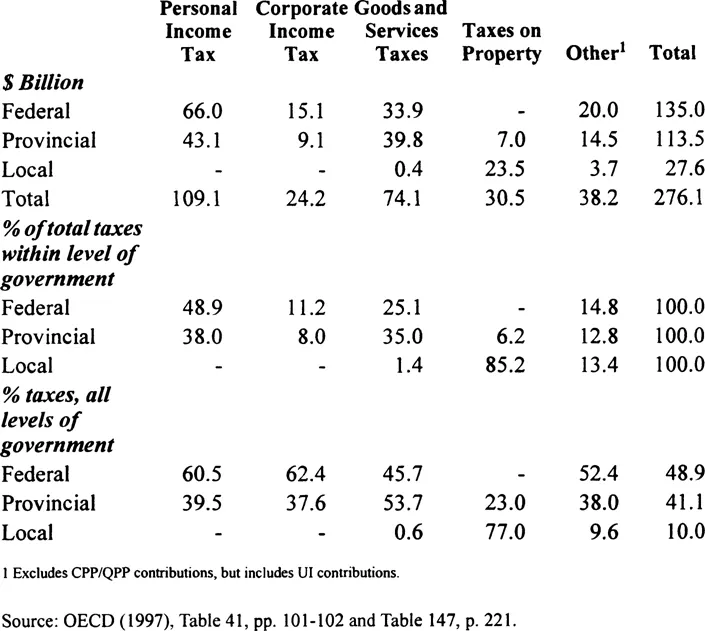
The tax mix is not markedly different between the federal and provincial governments. The federal government relies on income tax revenue (both personal and corporate) for 60 percent of the total while for provincial governments income taxes account for 46 percent of total revenue. Consumption taxes account for 25 percent of federal tax revenue and 35 percent of provincial tax revenue. Local governments rely almost entirely on real property taxes.
The intergovernmental comparison by revenue source shows that the income tax field is dominated by the federal government, which collects 61 percent of personal income tax revenue and 62 percent of corporate income tax revenue. The federal government also collects nearly half of consumption taxes and over half of other taxes. Real property taxes are almost entirely collected by local governments.
Elements of the Canadian Personal Income Tax System
The calculation of federal personal income tax payable can be briefly described by the following relationships:
Net Federal Tax | = | (Taxable Income times Statutory Tax Rates) minus Non-Refundable Credits plus Surtaxes |
Taxable Income | = | Gross Income minus Exclusions and Deductions |
Nine of the ten provinces apply their tax rates on the federal tax payable (an amount called the basic federal tax, or BFT) and have their personal income tax collected by the federal government. Taxpayers in those provinces have to file only one tax return for both federal and provincial taxes. Québec has its own separate provincial personal income tax, levied and collected separately. The calculation of taxable income in Québec is very similar to that of the federal taxable income. For instance, the same treatment is provided to capital gains, dividends, contributions to Registered Pension Plans (RPP) and Registered Retirement Savings Plans (RRSP) and expenses to earn income. For the nine provinces who have signed Tax Collection Agreements with the federal government, personal inco...
Table of contents
- Cover
- Title Page
- Copyright Page
- Table of Contents
- Figures and Tables
- Preface
- Introduction
- Part I The Canadian Tax System: A Brief Overview
- Part II Flat Taxes
- Part III Comprehensive Income Tax
- Part IV Summary Comparison of Tax Reform Proposals
- Conclusion
- Bibliography
Frequently asked questions
Yes, you can cancel anytime from the Subscription tab in your account settings on the Perlego website. Your subscription will stay active until the end of your current billing period. Learn how to cancel your subscription
No, books cannot be downloaded as external files, such as PDFs, for use outside of Perlego. However, you can download books within the Perlego app for offline reading on mobile or tablet. Learn how to download books offline
Perlego offers two plans: Essential and Complete
- Essential is ideal for learners and professionals who enjoy exploring a wide range of subjects. Access the Essential Library with 800,000+ trusted titles and best-sellers across business, personal growth, and the humanities. Includes unlimited reading time and Standard Read Aloud voice.
- Complete: Perfect for advanced learners and researchers needing full, unrestricted access. Unlock 1.5M+ books across hundreds of subjects, including academic and specialized titles. The Complete Plan also includes advanced features like Premium Read Aloud and Research Assistant.
We are an online textbook subscription service, where you can get access to an entire online library for less than the price of a single book per month. With over 1.5 million books across 990+ topics, we’ve got you covered! Learn about our mission
Look out for the read-aloud symbol on your next book to see if you can listen to it. The read-aloud tool reads text aloud for you, highlighting the text as it is being read. You can pause it, speed it up and slow it down. Learn more about Read Aloud
Yes! You can use the Perlego app on both iOS and Android devices to read anytime, anywhere — even offline. Perfect for commutes or when you’re on the go.
Please note we cannot support devices running on iOS 13 and Android 7 or earlier. Learn more about using the app
Please note we cannot support devices running on iOS 13 and Android 7 or earlier. Learn more about using the app
Yes, you can access An Economic Analysis of Income Tax Reforms by G.C Ruggeri,Carole Vincent in PDF and/or ePUB format, as well as other popular books in Business & Taxation. We have over 1.5 million books available in our catalogue for you to explore.