Originally published in 1981. This book unifies the diverse literature on the role of environmental factors in the uneven distribution of crime in society and provides an assessment of the validity of environmental explanations and their utility. It analyses and assesses the major work done by researchers in Britain, America and elsewhere. The extent of the differences between communities is reviewed from a number of perspectives. Offences are examined by location, nature and seriousness. Offenders are located in their environment and variations according to sex, age, race, social class, and recidivism are considered. The risks of victimisation also reflect environmental differences and need to be set in the context of wider community perceptions, fears, and attitudes to crime. The role of the community in the distribution of justice is also discussed.
- 188 pages
- English
- ePUB (mobile friendly)
- Available on iOS & Android
eBook - ePub
Crime and Environment
About this book
Trusted by 375,005 students
Access to over 1.5 million titles for a fair monthly price.
Study more efficiently using our study tools.
Information
1 OFFENCES AND THE ENVIRONMENT
The Classification of Offences
The most important basic distinction to be made within the range of criminal acts is between offences against the person and those against property. The former will include the homicide group (murder, manslaughter, infanticide); assaults and woundings; sexual offences; and robbery. Property offences comprise various kinds of theft; trust offences such as fraud and embezzlement; criminal damage; and arson. A third category is less easily defined in strictly criminal terms – so-called social disorganisation offences including drunkenness, drug-taking and prostitution. Although this third group properly demands examination of its environmental correlates, data difficulties are quite severe, and the discussion will focus primarily on personal and property offences. These distinctions are complicated in Britain by the method of prosecuting offenders. The 1977 Criminal Law Act redefined modes of trial: offences labelled ‘serious’ in British criminal statistics refer to those which are tried (1) only on indictment at a Crown Court or (2) either on indictment or summarily at a magistrates’ court at the discretion of the defendant. The scope of ‘serious’ offences differs slightly from the previous ‘indictable’ category (see Home Office, 1980, sections 1.17 and 1.18), but the terms will be used interchangeably in this volume. Most property offences are in the ‘serious’ category but a large number of minor assaults remain in the ‘summary’ category. Similar definitional problems exist in the United States with the FBI statistics.
Table 1.1 gives the breakdown of serious offences for England and Wales in 1979. The predominance of property offences is abundantly clear – over 95 per cent of the total. In terms of numbers, offences against the person are much rarer (about 5 per cent). In order to highlight right away some of the considerable variation which exists in the incidence of different types of offending, location quotients are calculated for three contrasting police authorities. The Metropolitan Police is by far the largest police force in Britain — some 22 per cent of serious crime in England and Wales occurs within its jurisdiction. Robbery is the offence which is relatively most prevalent in London. Sexual offences and violence are well below the national proportion.
Humberside is a medium-sized county, fairly urbanised but without a large conurbation. It stands in marked contrast to London, with a high proportionate incidence of personal violence and sexual offences and lower than average rates for robbery and fraud. The patterns for Lincolnshire, a largely rural police area, present yet further contrasts. While sexual offences occupy a higher proportion than in either of the more urbanised areas, personal violence is not so exaggerated as in Humberside. As might be expected, robbery is least likely in the rural context although, curiously, criminal damage is relatively more prevalent. Burglary is less common in Lincolnshire but otherwise it and theft show little tendency to be differentiated between police areas.
Table 1.1: Serious Offences Recorded as Known to the Police: England and Wales,1979
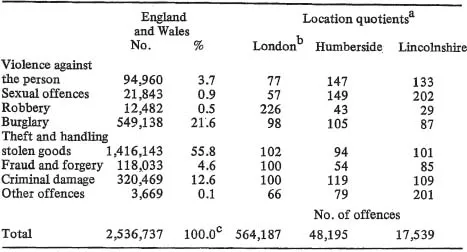
a. Location quotients measure the concentration of serious offences relative to the national average. An area with exactly the national average proportion of offences in a category would have an LQ of 100 for that category. The higher the LQ, the greater the proportionate incidence of that offence type.
b. Metropolitan Police District and City of London.
c. Percentage cohunn does not add up due to rounding.
Source: Home Office (1980), Table 32; LQ calculations by author.
The lesson to be learnt from these figures is that any breakdown of the crime rates, either by areas or by types of crime, instantly reveals considerable and conflicting disparities. And this is only within officially recorded crime: true crime rates may be of the order of two to ten times higher. Moreover, the relationship between true and official crime is itself subject to wide variation. In America, victimisation surveys have found (Table 1.2) that only 27 per cent of rape incidents get reported and the proportion of burglaries notified to the police is little higher. At the other extreme, for homicide and vehicle theft, reported crime actually exceeds estimates of the true incidence (homicide victims don’t normally have the opportunity of reporting their experience; insurance considerations motivate reporting vehicle theft). Overall rather less than half of serious crime in the United States is reported. In a survey of London, Sparks et al. (1977) suggest that less than one-third of criminal victimisations are notified to the police. From the official rate we cannot tell whether the high proportion of sexual offences in Lincolnshire is because that county is a hotbed of sexual deviation or because such offences are much more likely to be reported in tightknit rural and small town communities.
Table 1.2: Relations Between Real and Official Crime Rates: United States, 1965–6
| Rates per 100,000 population | Official as per cent of real | ||
| Crime type | |||
| Reala | Officialb | ||
| Homicide | 3.0 | 5.1 | 170 |
| Forcible rape | 42.5 | 11.6 | 27 |
| Robbery | 94.0 | 61.4 | 65 |
| Aggravated assault | 218.3 | 106.6 | 49 |
| Burglary | 949.1 | 296.6 | 31 |
| Larceny (over $50) | 606.5 | 267.4 | 44 |
| Vehicle theft | 206.2 | 226.0 | 110 |
| All Part I Crimes | 2119.6 | 974.7 | 46 |
a. Estimated from national victimisation survey.
b. Uniform crime reports adjusted to exclude non-residential burglary and larceny.
Source: Ennis (1967).
Gross Offence Rate
International comparisons of gross offence rates are almost impossible because of differences in the scope and coverage of legal and judicial systems. At various sub-national spatial scales, however, the gross rate provides an introduction to the discussion of particular crimes. Even so we should be wise not to expect too much from the gross offence rate – it can, as we shall see, be quite misleading.
(a) Regional Variations
Regional variations in overall crime rates can be considerable. Harries (1971), in a study of the United States, shows that the rate varies from 634 offences per 100,000 population (North Dakota) to 3,764 (California). In general, crime rates are highest in the most urbanised regions (Northeast, Midwest and Pacific coast) and lowest in the rural Mountain, Great Plains and Southern states (see Figure 1.1). In Britain regional variations are less exaggerated but nevertheless are still clear (Figure 1.2). However, most commentators on this level of analysis take pains to point out that, with the exception of violence, the real relationship is between crime and urbanisation and that regional variations coincidentally reflect differences between regions in the size and importance of urban agglomerations.
Figure 1.1: Regional Variation in Gross Crime ...
Table of contents
- Cover
- Half Title
- Title Page
- Copyright Page
- Original Title Page
- Original Copyright Page
- Contents
- List of Tables
- List of Figures
- Dedication
- Acknowledgements
- Introduction
- 1. Offences and the Environment
- 2. Offenders in Their Environment
- 3. Ecological Areas and Crime
- 4. Crime and the Community
- 5. The Distribution of Justice
- 6. The Role of Environmental Factors in Crime
- 7. Reflections
- Bibliography
- Index
Frequently asked questions
Yes, you can cancel anytime from the Subscription tab in your account settings on the Perlego website. Your subscription will stay active until the end of your current billing period. Learn how to cancel your subscription
No, books cannot be downloaded as external files, such as PDFs, for use outside of Perlego. However, you can download books within the Perlego app for offline reading on mobile or tablet. Learn how to download books offline
Perlego offers two plans: Essential and Complete
- Essential is ideal for learners and professionals who enjoy exploring a wide range of subjects. Access the Essential Library with 800,000+ trusted titles and best-sellers across business, personal growth, and the humanities. Includes unlimited reading time and Standard Read Aloud voice.
- Complete: Perfect for advanced learners and researchers needing full, unrestricted access. Unlock 1.5M+ books across hundreds of subjects, including academic and specialized titles. The Complete Plan also includes advanced features like Premium Read Aloud and Research Assistant.
We are an online textbook subscription service, where you can get access to an entire online library for less than the price of a single book per month. With over 1.5 million books across 990+ topics, we’ve got you covered! Learn about our mission
Look out for the read-aloud symbol on your next book to see if you can listen to it. The read-aloud tool reads text aloud for you, highlighting the text as it is being read. You can pause it, speed it up and slow it down. Learn more about Read Aloud
Yes! You can use the Perlego app on both iOS and Android devices to read anytime, anywhere — even offline. Perfect for commutes or when you’re on the go.
Please note we cannot support devices running on iOS 13 and Android 7 or earlier. Learn more about using the app
Please note we cannot support devices running on iOS 13 and Android 7 or earlier. Learn more about using the app
Yes, you can access Crime and Environment by R. N. Davidson in PDF and/or ePUB format, as well as other popular books in Social Sciences & Criminology. We have over 1.5 million books available in our catalogue for you to explore.