Since coal is seen by many as the logical solution to the nation's energy crisis, strip mining operations will continue. But they will continue amid intense public debate, much of it centering on the standards that will govern reclamation. In this book leading authorities address the economic, environmental, and legal ramifications of land reclamation following coal surface mining, review the status of the coal industry, and look at possible future developments.
- 502 pages
- English
- ePUB (mobile friendly)
- Available on iOS & Android
eBook - ePub
About this book
Trusted by 375,005 students
Access to over 1.5 million titles for a fair monthly price.
Study more efficiently using our study tools.
Information
Part 1
Surface Mining in Perspective
1
Recent Trends in the Geography of Coal
Conditions for the location of economic activity frequently are stated in physical and economic terms. Institutional factors must also be considered. A pervasive institutional element is legal restraint which derives from legislative and administrative fiat. Governmental regulations imposed since the 1960s have caused profound changes in the coal industry of the United States. This study is concerned with these events which have coincided with rapidly escalating demands and prices for energy.
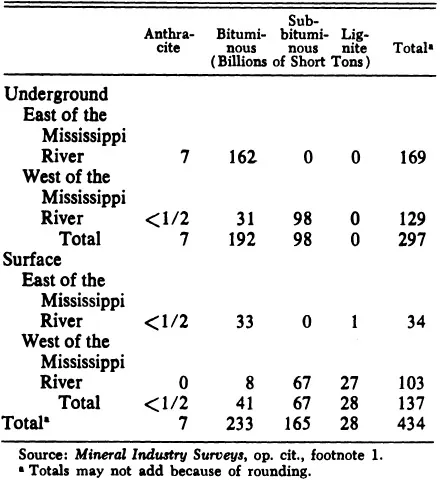
Coal is this nation’s most copious energy source. The current demonstrated coal reserve base (economically and legally available) is 434,000,000,000 tons (393,718,000,000 metric tons).1 Eight times this quantity is believed to exist based on actual surveys and theoretical extrapolation (Table 1).2 The demonstrated base will most likely increase as more exploratory drill holes are made in western states. Coal output for domestic use and export in 1975 was a record 640,000,000 tons (580,598,000 metric tons).3 Coal production in the United States increased from its inception in the eighteenth century until the 1920s. After that the disadvantages of coal such as dirt, inconvenience, bulk, relatively low-energy content, production dangers, and high extraction and transport costs caused a decline in coaľs contribution to national energy consumption relative to petroleum and natural gas. World War II energy demands resulted in a brief rise in output, but absolute and comparative attrition in coal production continued until the early 1960s. Coal output has risen since 1960 to current record levels, although coaľs relative contribution to total national energy
Table 1.—DEMONSTRATED COAL RESERVE BASE OF THE UNITED STATES ON JANUARY 1, 1974, BY AREA, RANK AND POTENTIAL METHOD OF MINING
consumption continues to decrease.4 In large measure this has been a response to direct and indirect governmental intervention. Wellhead price ceilings set by the Federal Power Commission produce artificially low prices on petroleum products and natural gas. Other elements include the removal of oil import quotas for East Coast users of residual oil, the 1970 mandate to the Environmental Protection Agency (EPA) to reduce coal-induced atmospheric pollutants, and, to a lesser degree, the Atomic Energy Commission’s encouragement of nuclear power plant construction. Coaľs contribution to energy production declined from nearly ninety percent in 1900 to approximately seventeen percent today (Tables 2 and 3).5 Recent shortages, international difficulties, uncertain availability of preferred fuels, technical difficulties in expanding nuclear energy production, and increasing prices for alternative fuels have inspired a reassessment of the role coal should play in satisfying current and future energy demands. A rapid and massive return to coal is frequently promoted as a feasible solution to the national energy shortage. Federal regulations on air contaminants and miners’ safety, state land reclamation requirements, strikes, and market uncertainties are claimed to be impediments to this transition.
Table 2.—UNITED STATES COAL CONSUMPTION (Millions of Short Tons)
| Sector | 1965 | 1973 | Percentage Change |
| | |||
| Electrical power | 244.9 | 387.6 | +58 |
| Coke plants | 95.3 | 94.1 | — 1 |
| Industrial | 104.1 | 68.1 | —35 |
| Retail | 22.1 | 11.1 | —50 |
| Exports | 52.3 | 52.9 | + 1 |
| Total | 518.7 | 613.8 | +18 |
Source: Federal Energy Administration, Project Independence Report (November, 1974), p. 100.
Table 3.—FUEL CONSUMPTION FOR ELECTRICITY GENERATION (Million Short Tons of Coal Equivalent)
| Fuel | 1965 | 1973 | Percentage Change |
| | |||
| Coal | 245 | 388 | + 58 |
| Oil | 28 | 121 | + 332 |
| Gas | 96 | 154 | + 60 |
| Nuclear | 2 | 36 | +1800 |
| Total | 371 | 699 | + 88 |
Source: Federal Energy Administration, Project Independence Report (November, 1974), p. 100.
Air Pollution Abatement
Federal involvement with air pollution abatement commenced in 1955 with amendments in 1963, 1965, and 1967, but was limited largely to a technical, advisory, and persuasive role in assisting state and local governments with existing pollution control programs. The landmark Clean Air Act Amendments (P.L. 91–604) of December 31,1970, placed the responsibility for setting standards solely in the hands of the federal government and specifically under the newly created EPA. This legislation provided a series of amendments which were couched in mandatory terms including a series of primary standards necessary to protect public health which were to be met by July 1975. The separate states were to develop their own implementation programs to comply with federal standards. The EPA monitors the abatement processes and may impose its own programs if it is not satisfied with the plans and progress made. Since 1955 the federal role has gradually proceeded from attempts to stimulate local and state pollution-control machinery to more rigorous federal intervention, complete with the coercive force of jail terms and fines. This is considerably more humane than the 1306 A.D. royal edict of Edward I of England which meted out death by hanging for persons producing pestilential odors from coal! By July, 1975, the 1970 Amendments had been somewhat successful in reaching their goals, but numerous variances and postponements retarded their achievement considerably. This law also set secondary air-quality standards which pertain to quality of life including effects on flora and fauna, structures, and atmospheric visibility. These are to be achieved by 1977, but the indeterminate nature of this phase of the law will make it more difficult to enforce.6
The major concern with the combustion of coal is the control of oxides of sulfur. Other pollutants such as oxides of nitrogen, carbon monoxide, and hydrocarbons can be controlled effectively by a combination of duration and temperature of combustion, available air, rate of emission cooling, and fuel-air contact and turbulence. Sulfur is an element which accompanies coals in varying degrees. American coals contain from 0.2 to 7 percent sulfur, but values from 1 to 2 percent are most frequently encountered (Figure 1).7 High-sulfur coals are of marine origin and are overlain by fossiliferous shales and limestones, whereas the low-sulfur coals are roofed by nonmarine shales which bear plant fossils.8
Sulfur is an undesirable component of coal. It lowers the quality of coke as a reduction agent in the production of steel, and it enhances corrosion, air pollution, and boiler deposits. Unfortunately, some coal-burning operations must be redesigned or modified to accept the cleaner low-sulfur coals because of the higher ash-softening temperatures required. The fly ash from high-sulfur coals is more readily ionized, however, and thereby more amenable to removal in electrical precipitators.
The federal performance standard for sulfur dioxide (SO2) is 1.2 pounds (0.54 kg.) of SO2 per 1,000,000 Btu (251,996,000 g. cal.) of energy production for new emission sources. This is frequently termed the New Source Performance Standard for large boilers (NSPS). Pollution sources that existed prior to 1970 (“old” sources) are controlled by state statutes as required under federal law and these sources frequently have less stringent standards, such as intermittent use of scrubbers under adverse meteorological conditions. “Old” sources in metropolitan areas such as St. Louis, Chicago, and Peoria must conform to a maximum of 1.8 pounds (0.82 kg.) of SO2 per 1,000,000 Btu, whereas those in areas beyond large cities are subjected to a less stringent maximum of 6 pounds (2.72 kg.) per 1,000,000 Btu. This is the equivalent of approximately three percent sulfur in average bituminous coal.9 The location of “old” plants thus strongly influences their choice of fuel.
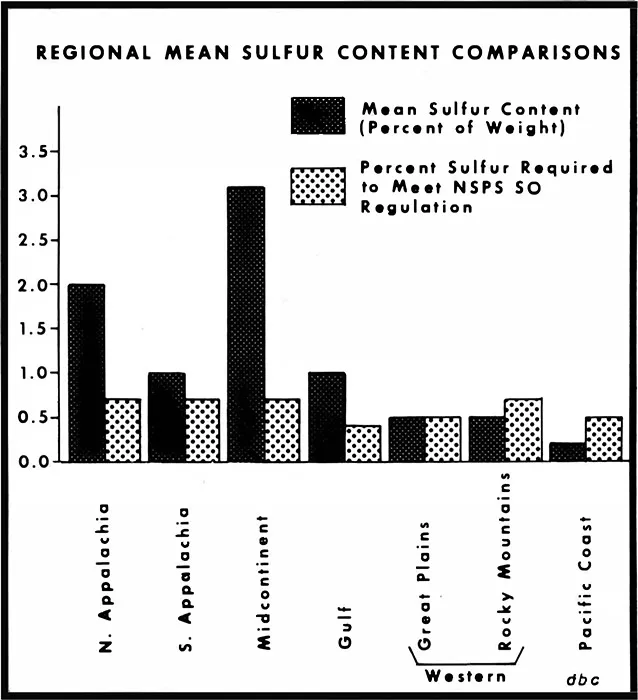
Figure 1. Regional differences in percentage of sulfur required to meet NSPS for SO2 result from variations in energy content of coals. Source: Adapted from Federal Energy Administration, op. cit., footnote 7, p. 104.
Acceptable regional ambient air-quality conditions can be achieved only by regulating point-source emissions. The Act specifically directs that flue emission measurements be taken at the stack. As ninety-five percent of available sulfur normally is converted to SO2 during combustion, this requirement must be met by reducing fuel-sulfur content or by cleansing gaseous emissions.10 The U.S. Bureau of Mines reports that only thirty-five percent of coals east of the Mississippi can be cleansed t...
Table of contents
- Cover
- Half Title
- Title
- Copyright
- Dedication
- Contents
- Introduction
- Part 1 Surface Mining in Perspective
- Part 2 Environmental Impacts
- Part 3 Economic Impacts
- Part 4 Legal Impacts
- Part 5 The Future of Surface Mining
- Glossary of Surface Mining and Reclamation Terminology
Frequently asked questions
Yes, you can cancel anytime from the Subscription tab in your account settings on the Perlego website. Your subscription will stay active until the end of your current billing period. Learn how to cancel your subscription
No, books cannot be downloaded as external files, such as PDFs, for use outside of Perlego. However, you can download books within the Perlego app for offline reading on mobile or tablet. Learn how to download books offline
Perlego offers two plans: Essential and Complete
- Essential is ideal for learners and professionals who enjoy exploring a wide range of subjects. Access the Essential Library with 800,000+ trusted titles and best-sellers across business, personal growth, and the humanities. Includes unlimited reading time and Standard Read Aloud voice.
- Complete: Perfect for advanced learners and researchers needing full, unrestricted access. Unlock 1.5M+ books across hundreds of subjects, including academic and specialized titles. The Complete Plan also includes advanced features like Premium Read Aloud and Research Assistant.
We are an online textbook subscription service, where you can get access to an entire online library for less than the price of a single book per month. With over 1.5 million books across 990+ topics, we’ve got you covered! Learn about our mission
Look out for the read-aloud symbol on your next book to see if you can listen to it. The read-aloud tool reads text aloud for you, highlighting the text as it is being read. You can pause it, speed it up and slow it down. Learn more about Read Aloud
Yes! You can use the Perlego app on both iOS and Android devices to read anytime, anywhere — even offline. Perfect for commutes or when you’re on the go.
Please note we cannot support devices running on iOS 13 and Android 7 or earlier. Learn more about using the app
Please note we cannot support devices running on iOS 13 and Android 7 or earlier. Learn more about using the app
Yes, you can access Coal Surface Mining by James E. Rowe in PDF and/or ePUB format, as well as other popular books in Politics & International Relations & Politics. We have over 1.5 million books available in our catalogue for you to explore.