With a specific focus on the United States and the United Kingdom, Carbon Inequality studies the role of the richest people in contributing to climate change via their luxury consumption and their investments. In an innovative contribution, it attempts to quantify personal responsibility for shareholdings in large fossil fuel companies.
This book explores the implications of the richest people's historic responsibility for global warming, the impacts of which affect them less than most others in global society. Kenner analyses how the richest people running large oil and gas companies have successfully used their political influence to lobby the US and UK government. This assessment of their growing political power is particularly pertinent at a time of increasing inequality and growing public awareness of the impact of climate change. The book also highlights the crucial role of the richest in blocking the low-carbon transition in the US and the UK, exploring how this could be countered to ensure fossil fuels are fully replaced by renewable energy.
This book will be of great relevance to scholars and policy makers with an interest in inequality, climate change and sustainability transitions.
Trusted by 375,005 students
Access to over 1.5 million titles for a fair monthly price.
When I began my research on the environmental impact of the richest people (see Kenner, 2015), their luxury lifestyle was an intuitive place to start. Images of wealthy people flying around the world in their private jets to mansions are probably at the forefront of the popular imagination when thinking about the role of the richest in climate change.
This chapter will argue that, per person, rich individuals consume in more high-carbon ways compared to other citizens. As many of the existing studies on this area calculate the carbon footprint of the richest 1% by income, I have concentrated on this group of the richest people in the US and the UK. The focus here is personal direct and indirect emissions, for example, from driving, flying or owning several luxury cars. This does not address emissions associated with business travel and hospitality, which, while a crucial area to deal with, are beyond the scope of this book.
1.1 Luxury lifestyles
The unequal ability to pollute is not a new phenomenon. Wealth has always determined access. In the US of the 1930s cars were luxury goods and were very expensive until they became more widely owned from the 1940s. There was a similar trend in Europe from the 1950s to the 1960s. Similarly, flying started as an elite mode of transportation. After the Second World War the airlines opened up flying to more passengers but it was still the richest who flew the most, epitomised by the use of Concorde from the mid-1970s. In the period prior to mass consumption of these high-carbon forms of transport it was the rich minority in the US and the UK who held greater historical responsibility for consumption-based emissions from cars and flying.
Moving to the present day there are many examples of how these lifestyles are high-carbon. Several websites give an insight into the consumption patterns of the richest, such as the Forbes Cost of Living Extremely Well Index, 1 and How to Spend It. 2 What these sources reveal is that the richest live in large luxurious residences (with some of the very rich owning their own islands) and own luxury cars, yachts, private jets and submarines. Social media provides a graphic insight into the extravagant lifestyles of wealthy young people, including their use of private jets and luxury cars. Their social calendar includes exclusive events such as the annual Davos World Economic Forum and the Dubai International Boat Show. These emblematic examples confirm academic research which finds a correlation between the level of income and the size of carbon footprint.3
Moving from these symbolic examples, is it possible to quantify the high-carbon lifestyle of the richest people in the US and the UK? Several academic studies estimate the carbon footprint of the richest income group in each of these countries. In November 2015 Chancel and Piketty published a paper exploring carbon inequality in countries around the world.4 They use their data to obtain global estimates of carbon inequality. They argue it is important to look at what is happening with high emitters within countries as well as between countries. Chancel and Piketty focus on consumption-based emissions. This attributes emissions to the final consumers rather than the companies producing these goods and services. They have a particular emphasis on indirect emissions (e.g. from goods such as food and services such as hotels). Their methodology is based on national level data, including per capita CO2e emissions (carbon dioxide equivalent), consumption-based CO2e emissions, and income inequality covering the period 1998–2013. They stress that their data should be treated with care and not as definitive. Therefore, the results presented below for the US and the UK should be seen as estimates of what could be happening rather than the actual figures of each income group.
Chancel and Piketty estimate that the top 10% of emitters in all countries account for around 45% of global emissions. Their data shows that in the US and other high-emitting countries such as the UK, Australia, Canada, China, France, Germany, Mexico, India, Indonesia, Russia, Saudi Arabia and Japan the richest 1% by income (in each of these countries) have much higher average CO2e emissions per person. Whilst acknowledging the diversity of national contexts it is clear that, the issue of carbon inequality is relevant to a range of countries. For example, in Nigeria it is estimated that rich individuals who made their money from oil spent $6.5 billion on private jets between 2007 and 2012.5
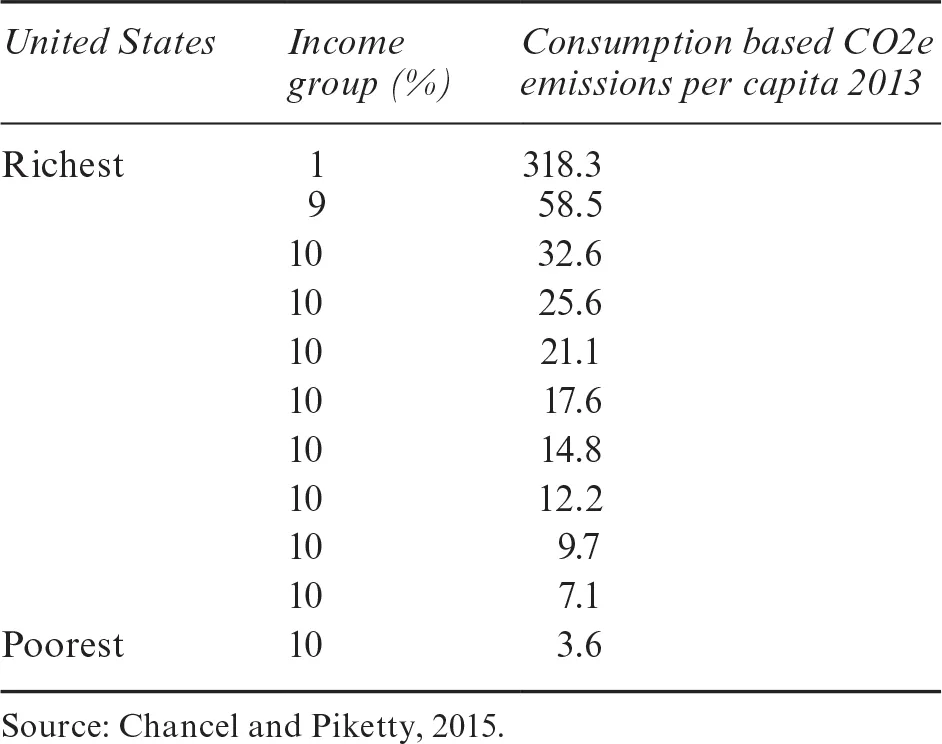
The country where the people making up the richest 1% are estimated to have the highest per capita carbon footprint is the US. Chancel and Piketty calculate that in 2013 the average emissions per person of the richest 1% (3.2 million people) were around 318 metric tons of CO2e. In comparison the average emissions per person of the poorest 10% (around 31 million people) were around 3.6 metric tons of CO2e. For the top 1%, Chancel and Piketty estimate 55 metric tons per person from direct emissions such as transport and household energy. The rest comes from indirect emissions of which investments are likely to be a large part. In Chapter 2 of this book, I present evidence on emissions associated with investments. This indicates that Chancel and Piketty are correct in their intuition that the largest portion of personal emissions of the richest people comes from the shares they hold.
Table 1.1 Per capita consumption-based emissions in the US in 2013
Chancel and Piketty’s data shows that the unequal distribution of greenhouse gas emissions has likely deepened over the last 15 years. The only income group which saw their carbon footprint increase between 1998 and 2013 was the richest 1% whose average annual emissions per person rose from 289 to 318 metric tons of CO2e. Meanwhile, the remaining 99% saw their average annual emissions per person fall slightly over the period 1998 to 2013. This applies to all of the 99%, although clearly there are significant differences in the size of footprint (see Table 1.1). It is interesting to note that carbon inequality is estimated to have got worse in the US at the same time as income and wealth inequality dramatically increased, most notably in the hands of the richest 1%. Therefore, it would appear there is a link between rising inequality and carbon inequality.
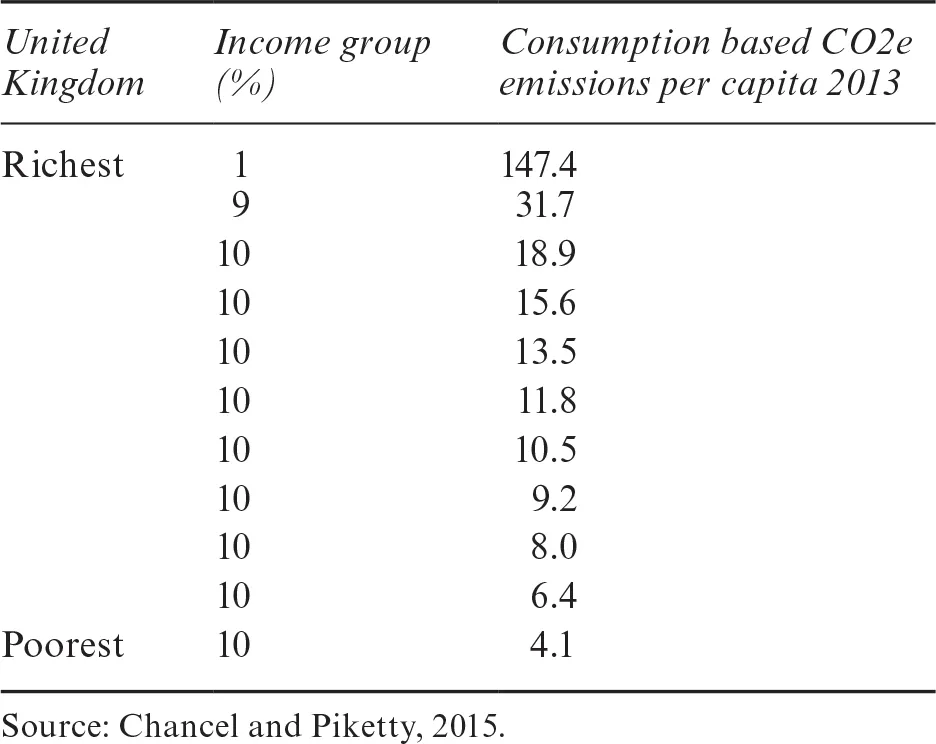
In the UK, Chancel and Piketty estimate that in 2013 the richest 1% of people (around 64,000 people) were responsible for 147 metric tons of greenhouse gas emissions per person. In comparison the poorest 10% (around 6.4 million people) were responsible for around 4 metric tons of greenhouse gas emissions per person in 2013 (Table 1.2).
In December 2015 Oxfam published a report on Extreme Carbon Inequality using a similar methodology to that of Chancel and Piketty.6 In it they estimate that someone who is in the richest 1% by income in the world could have an average footprint as much as 175 times that of someone in the poorest 10%. They calculate that the richest 10% are responsible for around 50% of global emissions compared to just 10% for the poorest 50%. In a more recent study Hubacek et al call for more focus on the link between economic inequality and high-carbon lifestyles.7 They estimate that globally the richest 10% by income were responsible for an estimated 36% of emissions as a result of goods and services they consumed. This factored in the production process all the way along global supply chains. In a more recent study a typical high wealth household was estimated to have an annual carbon footprint of 129.3 metric tons of CO2e, with the main source of emissions being air travel.8
Table 1.2 Per capita consumption-based emissions in the UK in 2013
1.2 Country-specific studies
There are several national studies that attempt to put a figure on the pollution of the rich and compare this to the rest of the population. Jorgenson et al concluded that there were higher state-level emissions in US states where the wealthy captured more income. They found that combined consumption-based emissions from all sectors at the US federal state level were positively linked with the income share of the top 10%, top 5% and top 1% between 1997 and 2012.9 This builds on a prior preliminary study by Jorgenson et al which found that income inequality (measured by the Theil household income inequality index) did increase residential carbon emissions in each state in the US.10 Their hypothesis is that when income is concentrated at the top, there will be higher emissions because the rich will pollute via the overconsumption of goods and services (such as large homes, cars, boats and planes) which require high energy use. They also argue the rich use their political influence to evade measures to control emissions, an issue I cover in Chapter 4.
Ummel brought together data on the consumption of 6 million households between 2008 and 2012 in 52 areas of expenditure including electricity, gasoline, natural gas, heating oil, air travel, food and drink and other services. He estimated that the richest 10% of US polluters were responsible for around 25% of national emissions. He looked at the top 2% and found that their individual average footprint was over four times higher than those in the bottom 20% of the population. Crucially, for the top 2% around 75% of their emissions were from indirect sources, a finding that correlates with Chancel and Piketty’s findings on the importance of indirect emissions.11 Cohen built on Ummel’s work to apply it to New York. He found that Manhattan, the richest borough, had the highest consumption-based emissions.12
In the UK there are a number of studies which find that the richest income group in the UK have high-consumption carbon footprints.13 Druckman and Jackson found that the higher the disposable income the higher the carbon emissions. According to their study, the richest segment emitted 64% more carbon dioxide compared to the segment with the lowest emissions.14 They based these findings on a quasi-multiregional input-output model which captured emissions from direct fuel use (personal vehicle use and flying) and in particular from emissions embedded in household goods and services. In earlier research they found that this trend deepened significantly between 1968 and 2000 because of high-income groups increasing their demand for travel (often by private car) and for energy resources such as heat and light in their homes.15 In an earlier study Majima and Warde used Family Expenditure Surveys in the UK between 1961 and 2004 to track the consumption patterns of the richest 1% by income. They noticed shifts during this time period from household goods to personal luxury items such as jewellery, a shift from luxury food and al...
Table of contents
Cover
Half Title
Series Page
Title Page
Copyright Page
Table of Contents
List of figures
List of tables
Acknowledgements
Introduction
1 The carbon footprint of luxury consumption
2 The investment emissions of the polluter elite
3 The polluter elite and moral responsibility
4 The decisive political influence of the polluter elite
5 Destabilising the polluter elite
Conclusions
Appendix 1
Appendix 2
Index
Frequently asked questions
Yes, you can cancel anytime from the Subscription tab in your account settings on the Perlego website. Your subscription will stay active until the end of your current billing period. Learn how to cancel your subscription
No, books cannot be downloaded as external files, such as PDFs, for use outside of Perlego. However, you can download books within the Perlego app for offline reading on mobile or tablet. Learn how to download books offline
Perlego offers two plans: Essential and Complete
Essential is ideal for learners and professionals who enjoy exploring a wide range of subjects. Access the Essential Library with 800,000+ trusted titles and best-sellers across business, personal growth, and the humanities. Includes unlimited reading time and Standard Read Aloud voice.
Complete: Perfect for advanced learners and researchers needing full, unrestricted access. Unlock 1.5M+ books across hundreds of subjects, including academic and specialized titles. The Complete Plan also includes advanced features like Premium Read Aloud and Research Assistant.
Both plans are available with monthly, semester, or annual billing cycles.
We are an online textbook subscription service, where you can get access to an entire online library for less than the price of a single book per month. With over 1.5 million books across 990+ topics, we’ve got you covered! Learn about our mission
Look out for the read-aloud symbol on your next book to see if you can listen to it. The read-aloud tool reads text aloud for you, highlighting the text as it is being read. You can pause it, speed it up and slow it down. Learn more about Read Aloud
Yes! You can use the Perlego app on both iOS and Android devices to read anytime, anywhere — even offline. Perfect for commutes or when you’re on the go. Please note we cannot support devices running on iOS 13 and Android 7 or earlier. Learn more about using the app
Yes, you can access Carbon Inequality by Dario Kenner in PDF and/or ePUB format, as well as other popular books in Politics & International Relations & Sustainable Development. We have over 1.5 million books available in our catalogue for you to explore.