- 456 pages
- English
- ePUB (mobile friendly)
- Available on iOS & Android
About this book
Crime Prevention: Approaches, Practices, and Evaluations, Tenth Edition, meets the needs of students and instructors for engaging, evidence-based, impartial coverage of interventions that can reduce or prevent deviance. This edition examines the entire gamut of prevention, from physical design to developmental prevention to identifying high-risk individuals to situational initiatives to partnerships and beyond. Strategies include primary prevention measures designed to prevent conditions that foster deviance; secondary prevention measures directed toward persons or conditions with a high potential for deviance; and tertiary prevention measures to deal with persons who have already committed crimes.
In this book, Lab offers a thorough and well-rounded discussion of the many sides of the crime prevention debate in clear and accessible language, including the latest research concerning space syntax, physical environment and crime, neighborhood crime prevention programs, community policing, crime in schools, and electronic monitoring and home confinement.
This book is essential for undergraduates studying criminal justice, criminology, and sociology, in the US and globally. Online resources include an instructor's manual, test bank, and lecture slides for faculty, and a wide array of resources for students.
Frequently asked questions
- Essential is ideal for learners and professionals who enjoy exploring a wide range of subjects. Access the Essential Library with 800,000+ trusted titles and best-sellers across business, personal growth, and the humanities. Includes unlimited reading time and Standard Read Aloud voice.
- Complete: Perfect for advanced learners and researchers needing full, unrestricted access. Unlock 1.4M+ books across hundreds of subjects, including academic and specialized titles. The Complete Plan also includes advanced features like Premium Read Aloud and Research Assistant.
Please note we cannot support devices running on iOS 13 and Android 7 or earlier. Learn more about using the app.
Information
Chapter 1 Crime and the Fear of Crime
Chapter Outline
- The Problem of Crime in Society
- Official Measures of Crime
- Measuring Victimization
- Summary
- The Costs of Crime/Victimization
- The Fear of Crime
- Defining Fear
- Measuring Fear
- The Level of Fear
- Fear and Crime
- Fear and Demographics
- Explaining the Divergent Findings
- Benefits of Fear
- Fear Summary
- Summary
Learning Objectives
- Identify and discuss different measures of crime and victimization.
- Identify shortcomings with measures of crime and victimization.
- Discuss the changing crime rates in the United States.
- Explain how a panel survey works.
- Provide information on the costs of crime/victimization.
- Give a definition of fear and discuss how it manifests itself.
- Explain the differences among fear, worry, and assessments of crime.
- Discuss the levels of fear in society and how fear relates to crime and victimization.
- Define vicarious victimization.
- Provide reasons for the reported levels of fear.
- Define incivility and show how it relates to fear.
The Problem of Crime in Society
Official Measures of Crime

ON THE WEB

Change in Violent Crime Rate (per 100,000 population)

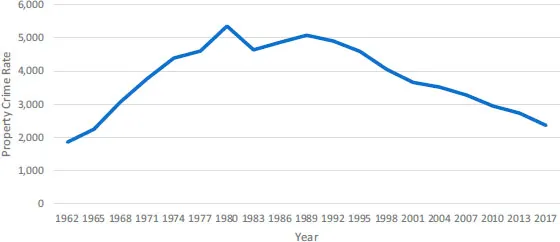
Change in Property Crime Rate (per 100,000 population)
Table of contents
- Cover
- Half Title
- Title
- Copyright
- Dedication
- Contents
- Preface to the Tenth Edition
- Acknowledgments
- Chapter 1—Crime and the Fear of Crime
- Chapter 2—Crime Prevention
- Chapter 3—Evaluation and Crime Prevention
- Part I Primary Prevention
- Part II Secondary Prevention
- Part III Tertiary Prevention
- Glossary
- References
- Name Index
- Subject Index