Generalized Additive Models
eBook - ePub

Generalized Additive Models

An Introduction with R, Second Edition

Simon N. Wood

Share book
  1. 476 pages
  2. English
  3. ePUB (mobile friendly)
  4. Available on iOS & Android
eBook - ePub

Generalized Additive Models

An Introduction with R, Second Edition

Simon N. Wood

Book details
Book preview
Table of contents
Citations

About This Book

The first edition of this book has established itself as one of the leading references on generalized additive models (GAMs), and the only book on the topic to be introductory in nature with a wealth of practical examples and software implementation. It is self-contained, providing the necessary background in linear models, linear mixed models, and generalized linear models (GLMs), before presenting a balanced treatment of the theory and applications of GAMs and related models.

The author bases his approach on a framework of penalized regression splines, and while firmly focused on the practical aspects of GAMs, discussions include fairly full explanations of the theory underlying the methods. Use of R software helps explain the theory and illustrates the practical application of the methodology. Each chapter contains an extensive set of exercises, with solutions in an appendix or in the book's R data package gamair, to enable use as a course text or for self-study.

Frequently asked questions

How do I cancel my subscription?
Simply head over to the account section in settings and click on “Cancel Subscription” - it’s as simple as that. After you cancel, your membership will stay active for the remainder of the time you’ve paid for. Learn more here.
Can/how do I download books?
At the moment all of our mobile-responsive ePub books are available to download via the app. Most of our PDFs are also available to download and we're working on making the final remaining ones downloadable now. Learn more here.
What is the difference between the pricing plans?
Both plans give you full access to the library and all of Perlego’s features. The only differences are the price and subscription period: With the annual plan you’ll save around 30% compared to 12 months on the monthly plan.
What is Perlego?
We are an online textbook subscription service, where you can get access to an entire online library for less than the price of a single book per month. With over 1 million books across 1000+ topics, we’ve got you covered! Learn more here.
Do you support text-to-speech?
Look out for the read-aloud symbol on your next book to see if you can listen to it. The read-aloud tool reads text aloud for you, highlighting the text as it is being read. You can pause it, speed it up and slow it down. Learn more here.
Is Generalized Additive Models an online PDF/ePUB?
Yes, you can access Generalized Additive Models by Simon N. Wood in PDF and/or ePUB format, as well as other popular books in Matematica & Probabilità e statistica. We have over one million books available in our catalogue for you to explore.

Information

Year
2017
ISBN
9781498728379
Chapter 1
Linear Models
How old is the universe? The standard Big Bang model of the origin of the universe says that it expands uniformly, and locally, according to Hubble’s law,
y=βx,
where y is the relative velocity of any two galaxies separated by distance x, and β is ‘Hubble’s constant’ (in standard astrophysical notation yv, xd and βH0). β−1 gives the approximate age of the universe, but β is unknown and must somehow be estimated from observations of y and x, made for a variety of galaxies at different distances from us.
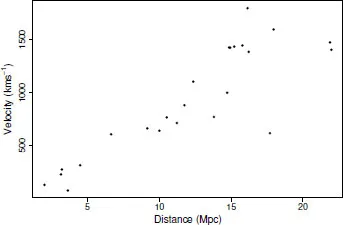
Figure 1.1 plots velocity against distance for 24 galaxies, according to measurements made using the Hubble Space Telescope. Velocities are assessed by measuring the Doppler effect red shift in the spectrum of light observed from the galaxies concerned, although some correction for ‘local’ velocity components is required. Distance measurement is much less direct, and is based on the 1912 discovery, by Henrietta Leavitt, of a relationship between the period of a certain class of variable stars, known as the Cepheids, and their luminosity. The intensity of Cepheids varies regularly with a period of between 1.5 and something over 50 days, and the mean intensity increases predictably with period. This means that, if you can find a Cepheid, you can tell how far away it is, by comparing its apparent brightness to its period predicted intensity.
Image
%
Figure 1.1 A Hubble diagram showing the relationship between distance, x, and velocity, y, for 24 galaxies containing Cepheid stars. The data are from the Hubble Space Telescope key project to measure the Hubble constant as reported in Freedman et al. (2001).
It is clear, from the figure, that the observed data do not follow Hubble’s law exactly, but given the measurement process, it would be surprising if they did. Given the apparent variability, what can be inferred from these data? In particular: (i) what value of β is most consistent with the data? (ii) what range of β values is consistent with the data and (iii) are some particular, theoretically derived, values of β consistent with the data? Statistics is about trying to answer these three sorts of questions.
One way to proceed is to formulate a linear statistical model of the way that the data were generated, and to use this as the basis for inference. Specifically, suppose that, rather than being governed directly by Hubble’s law, the observed velocity is given by Hubble’s constant multiplied by the o...

Table of contents