Using the water footprint concept, this impactful book aids our understanding of how we can reduce water consumption and pollution to sustainable levels.
Since the publication of the first edition, the question of how to reduce our water footprint has become even more urgent. Freshwater scarcity is increasingly perceived as a global systemic risk and overconsumption of water is widespread. The water footprint, a concept founded by the author, is an indicator of direct and indirect freshwater use by a consumer or producer that can be used to analyze water usage along supply chains and assess the sustainability, efficiency and fairness of our water use. This new edition is fully revised and updated to reflect continued developments in this rapidly growing field of knowledge. New chapters are added covering the history of the water footprint concept; the environmental footprint of the human species versus planetary boundaries; and the human right to water as a foundation to equitable sharing. All other chapters are fully revised with new findings, applications and references, including major new research on energy, vegetarian diets and intelligent water allocation over competing demands.
The Water Footprint of Modern Consumer Society is a key textbook for students of interdisciplinary water studies and those taking other related courses within the environmental sciences. It will also be of interest to those working in the governmental sector, environmental and consumer organizations, the business sector and UN institutions, where there is growing interest in the water footprint concept.
Trusted by 375,005 students
Access to over 1.5 million titles for a fair monthly price.
1 The environmental footprint of the human species
Since the latter part of the eighteenth century, humans have been altering the Earth at an unprecedented and unsustainable rate and scale by radically transforming the landscape, increasing natural resource use and rapidly generating waste. One way of quantifying the total human pressure on the natural environment is by way of calculating humanity’s ‘environmental footprint’. This term acts as an umbrella for the different footprint concepts that have been developed during the past two decades. Within the context of the Earth’s limited natural resources and assimilation capacity, the current environmental footprint of humankind is not sustainable. We use too much land, leaving too little for nature; in many places we also use too much water, leaving insufficient water in streams for maintaining healthy ecosystems; and we abstract too many elements from the Earth and dispose of too much waste back into the environment.
Often, we use more natural resources and emit more than necessary given technologies and best practices already available; some people contribute to a much greater extent to the aggregated global use of resources than others. Therefore, we need to understand not only the sustainability of resource use, but also the efficiency and equity. The study of land, water, energy, material and other footprints can help in that. In this chapter, I will review different footprints and relate those to maximum sustainable levels. Ultimately, major transformative changes in the global economy are necessary to reduce humanity’s environmental footprint to sustainable levels. Companies can play a role by becoming more resource-efficient. Consumers can contribute their part by reconsidering their consumption pattern. And governments have a major role in better regulation, providing incentives in the right direction and stimulating a more equitable use of natural resources across communities.
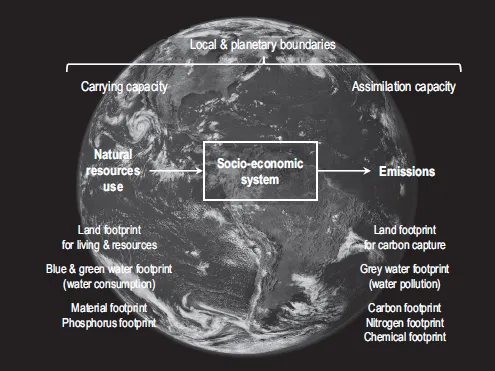
Common to all environmental footprints is that they quantify the human appropriation of natural capital as a source or a sink (Hoekstra, 2009; Galli et al., 2011; Giljum et al., 2011; Fang et al., 2014). Each specific footprint indicator focuses on one particular environmental concern, for instance, limited land, limited freshwater or limited capacity of the Earth to assimilate certain pollutants. A specific footprint indicator measures either resource appropriation or waste generation or both (Figure 1.1). Footprints are indicators of human pressure on the environment and form the basis for understanding environmental changes that result from this pressure (such as land use changes, land degradation, reduced river flows, water pollution, climate change) and resultant impacts (like biodiversity loss or effects on human health or the economy).
Figure 1.1 The environmental footprint of humankind measures natural resource use and emissions. Natural resource use is to be compared to the Earth’s carrying capacity; emissions are to be compared to the Earth’s assimilation capacity.
The footprint family
Let me introduce some members of the ‘footprint family’, the ones that are most common in the literature. The ‘ecological footprint’, the first footprint indicator, developed by Wackernagel and Rees (1996), measures the appropriation of land as a resource plus the land needed for waste uptake. The first component measures the areas that are in use as cropland, pasture, fishing grounds, built-up land and forestry. The second component, the land needed for waste uptake, generally focusses on measuring the forest land required for sequestering the carbon dioxide emitted through the burning of fossil fuels. The ecological footprint is measured in hectares, whereby actual hectares are weighted based on their biological productivity compared to the world average biological productivity per hectare. Since the ecological footprint refers to the use of bioproductive space in hectares, it is sometimes also called the land footprint. The latter term has become more attractive since the emergence of the other footprint indicators.
The water footprint, the second footprint indicator, which I introduced in 2002, measures the consumption of freshwater as a resource as well as the use of freshwater to assimilate waste (Hoekstra, 2003; Hoekstra et al., 2011). Three components are distinguished: the green, blue and grey water footprint. The ‘green’ water footprint refers to the consumption of so-called green water resources (rainwater), while the ‘blue’ water footprint measures the consumption of so-called blue water resources (groundwater and surface water). The term ‘consumption’ refers to loss of water from the available ground-surface water body in a catchment area. Losses occur when water evaporates, returns to another catchment area or the sea or is incorporated into a product. The ‘grey’ water footprint refers to the volume of water needed to assimilate pollutants from human activities that enter freshwater bodies.
The carbon footprint concept, sometimes also called the climate footprint, which can be traced back to 2005, measures the emission of greenhouse gasses to the atmosphere (Wiedmann and Minx, 2008). The carbon footprint is expressed in terms of CO2 equivalents; emitted greenhouse gases other than carbon dioxide, like methane and nitrous oxide, are translated into carbon dioxide equivalents based on their ‘global warming potential’.
A more recent footprint is the material footprint, which measures resource appropriation, focussing on the mining of raw materials (Lettenmeier et al., 2009). Two other footprints that have also been considered more recently are the phosphorus and nitrogen footprints. Even though they sound like brother and sister, they are quite different, because the one measures resource use while the other measures emissions. The phosphorus footprint refers to the mining of phosphorus, a scarce resource (Wang et al., 2011). The nitrogen footprint is defined as the loss of reactive nitrogen to the environment, an important pollutant leading to the eutrophication of streams, lakes and seas, which often comes together with large ecological damage (Leach et al., 2012). Yet another footprint proposed is the chemical footprint, which measures the release of different chemicals into the environment, to air, water and soil (Sala and Goralczyk, 2013; Zijp et al., 2014; Bjørn et al., 2014). Different chemicals are weighted here according to their potential harm, in a similar way to how different chemical loads entering a water body are weighted in the grey water footprint.
When we consider this list of footprints, it is clear that there is no principle limit: we can define an environmental footprint in relation to any specific environmental concern. Still, though, the footprints have something in common, as mentioned above. They all measure resource use and/or emissions along supply chains, whereby resource use and emissions associated with specific steps in the production chain of certain goods can be attributed to final products and consumers. The natural resource use and emissions in the production chain of consumer products can even be translated into certain (potential) environmental impacts. One can thus also distinguish impact-oriented footprints in addition to pressure-oriented footprints. Whereas the pressure-oriented footprints measure the use of natural resources and anthropogenic emission of chemicals into the environment, the impact-oriented footprints refer to the subsequent ecological impacts from resource use and emissions (Fang and Heijungs, 2015).
Footprint of consumption versus footprint of production
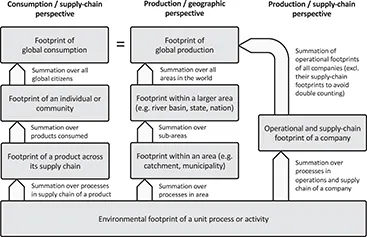
The basic building block of footprint accounts is the footprint of a single production process or human activity. Once we know the footprints of all single activities we can estimate the footprint of any product, consumer, or producer or the footprint within a certain geographical area, as shown in Figure 1.2. The footprint of a product is the sum of the footprints of all single steps in the production chain. The footprint of a consumer depends on the footprints of all goods and services consumed. Likewise, the footprint of a community of consumers – for example, the inhabitants of a country – is equal to the sum of the footprints of the members of the community. The footprint of global consumption is equal to the footprint of global production. Both equal the sum of the footprints of all human activities across the globe.
Figure 1.2 The relation between footprints of different entities. Based on Hoekstra (2017a).
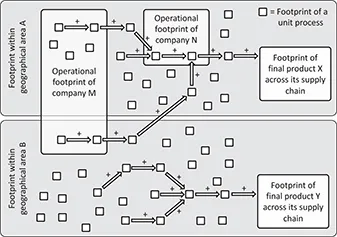
Figure 1.3 shows how footprint accounting over supply chains is done. As mentioned, the footprint of a final product follows from the footprints of the processes along the supply chain. These processes may take place in different geographical areas. The footprint of a company consists of direct (operational) and indirect (supply-chain) components. The operational footprint of a company is the sum of the footprints of its own operations. In reality, the economy does not consist of linear and converging supply chains as shown in Figure 1.3; this is done here for simplicity. The supply chains of different products are often interwoven and partly cyclic. In the case of two or more products following from one production process, footprint allocation procedures are applied to avoid double counting.
Figure 1.3 Footprint accounting over supply chains. Based on Hoekstra and Wiedmann (2014).
Human development criteria
Our environmental footprint cannot grow without limit because of the physical boundaries set by the environment in which we live and the need to maintain a good living environment for other species as well. The idea of ‘limits to growth’ goes back at least to the late eighteenth century, when Thomas Robert Malthus (1798) published his famous essay on the principle of population. A more recent milestone report was the limits to growth report for the Club of Rome by Meadows et al. (1972). The whole idea of limits got a new impulse with the publication of two papers by Rockström et al. (2009a, 2009b) on ‘planetary boundaries’ and a ‘safe operating space’ for humanity within those boundaries. Within the safe space we need to share resources and pollution quota fairly (Häyhä et al., 2016). We should be able to measure for every activity how it counts towards different planetary boundaries (Meyer and Newman, 2018). Since all people have basic needs and therefore a minimum demand for resources, Raworth (2017) speaks about a ‘safe and just space’ for humanity. Our manoeuvring space is limited not only at the upper side, by the planetary boundaries, but also at the lower side, by basic human needs (O’Neill et al., 2018).
Using the limited resources efficiently will enable us to share a greater pie. Popular terms used in this context are ‘resource efficiency’ and ‘eco-efficiency’. The terms are often used interchangeably, but eco-efficiency can be seen as being broader, because it can refer to low resource use per unit of product (resource efficiency) as well as low pollution per unit of product. We often see a one-sided focus on eco-efficiency, neglecting the issue of overall sustainability, which does not only depend on efficient production but also on the scale of production. A one-sided focus on efficiency also disregards the important issue of fair sharing. It is true that efficient production means that there will be more to share, but efficient production by itself does not imply actual fair sharing. We generally see the opposite: without redistribution, increased efficiency goes together with increased inequity.
The concepts of environmental sustainability, efficiency and fairness are three essential and complementary criteria for human development. Below, I will discuss environmental footprints in the context of environmental sustainability, eco-efficiency and social equity. In addition, I will take the perspective of resource security, which is an important development criterion as well.
Environmental sustainability
For each type of environmental footprint there is a maximum sustainable level. Footprints should remain below their maximum sustainable level, at global scale, and at smaller geographical scales as well. Sustainability depends on the size and spatiotemporal characteristics of humanity’s footprint relative to the Earth’s carrying capacity. We can distinguish both local thresholds and planetary boundaries. Local thresholds refer to boundaries that should not be crossed to prevent undesirable, sometimes irreversible, changes in the local environmental system. In lakes and streams, for example, we should limit the amount of chemicals entering the water as a result of our activities to prevent the natural ecosystem’s collapse towards a degraded state. Another example: in every biome, a distinct biological community in a particular type of habitat, we need to protect at least a certain fraction to prevent that type of biome from disappearing, which means that there is a limit to the amount of land occupied by that biome available for human use. Planetary boundaries are thresholds at the aggregate global level; traversing them could generate unacceptable changes in the bio-physical processes of the planet’s natural environments (Rockström et al., 2009a, 2009b). A planetary boundary can generally be seen as a sort of aggregate limit, related to the many local thresholds. I purposely say ‘sort of aggregate’ because the global system is a complex system with lots of non-linearities, so one cannot simply sum many local thresholds towards one global threshold. Besides, some phenomena are global in essence, notably climate change, so that we cannot consider the planetary boundary in relation to local thresholds altogether.
Establishing local or global thresholds in a precise way is impossible due to large uncertainties in the behaviour of local and regional environmental systems and the Earth system as a whole, but rough estimates can be made, and in some cases we can also quantity the uncertainties to some extent. Once we have roughly identified the local and global thresholds we know the space that we as human species can occupy without disturbing our living environment too much. The usefulness of environmental footprints is that they measure how much of the available capacity within the local or planetary boundaries is already consumed. In many cases, as I will summarize below, our footprint already exceeds the sustainable level, sometimes locally in many places, other times globally as well.
According to the 2018 accounts of the Global Footprint Network, the ecological footprint of humanity added up to 20.6 billion global hectares in 2014, which exceeded the maximum sustainable ecological footprint of 12 billion global hectares by a factor of 1.7 (Lin et al., 2018). The message that humanity is hence using way more than one planet’s worth of resources is one of the reasons that the ecological footprint concept has become a popular and effective tool to communicate unsustainability. The message has been criticized based on the argument that a large part of the overall ecological footprint (60 per cent in 2014) consists of the estimated amount of forest land needed to sequester the human-driven carbon dioxide emissions. If we would exclude that, we would use ‘only’ two-thirds of the Earth, which, however, is still a lot given that there are other species than humans. According to the Convention on Biological Diversity, an international treaty ratified by all UN member states (with the exception of the United States), at least 17 per cent of the terrestrial world is to be reserved for nature (CBD, 2010). This is a conservative estimate of what is actually needed according to experts. Svancara et al. (2005) reviewed over 200 estimates regarding the fraction of land to be set aside for biodiversity protection, from both expert studies and policy documents, and found that evidence-based estimates were on average nearly three times higher than policy-driven target values. Noss and Cooperrider (1994) estimate that generally 25 to 75 per cent of the land in a region needs to be reserved for securing biodiversity. According to the famous biologist Edward Wilson, we need to set apart half of the Earth for natural ecosystems to preserve the globe’s biodiversity (Wilson, 2016). So it is safe to assume that if we haven’t grossly exceeded the sustainable limit to our ecological footprint, we have certainly reached the max.
For the water footprint it is not easy to distinguish a planetary boundary. Overexploitation and pollution of water is primarily something that occurs locally and aggregates to the river basin level. Besides, time comes into play here, because overexploitation and pollution are more likely to occur and will be more severe in the dry periods of the year, and during relatively dry years. We have estimated that humanity’s blue water footprint, which refers to the consumptive use of groundwater and surface water resources, results in ‘severe water scarcity’ during at least one month per year in half of the world’s 405 largest river basins (Hoekstra et al., 2012). In a more recent study at high spatial resolution we estimated that, around the year 2000, two-thirds of the global population (4 billion people) lived under conditions of severe water scarcity at lea...
Table of contents
Cover
Half Title
Series Page
Title Page
Copyright Page
Table of Contents
List of illustrations
Preface to the first edition
Preface to the second edition
Acknowledgements
1. The environmental footprint of the human species
2. A brief history of water footprint thinking
3. Why do we overexploit our limited freshwater resources?
4. Drinking ten bathtubs of water a day
5. Water for bread and pasta
6. Meat and dairy, the biggest water users
7. How our cotton clothes link to a disappearing sea
8. The energy transition: how to combine carbon and water footprint reduction?
9. The overseas water footprint of cut flowers
10. The supply-chain water footprint of paper
11. Sustainability: water footprint caps per water body
12. Efficiency: water footprint benchmarks per product
13. Equitability: fair water footprint shares per community
14. Allocating the world’s limited freshwater resources
15. Getting trade right
16. Product transparency
17. Who will be the heroes of change?
References
Index
Frequently asked questions
Yes, you can cancel anytime from the Subscription tab in your account settings on the Perlego website. Your subscription will stay active until the end of your current billing period. Learn how to cancel your subscription
No, books cannot be downloaded as external files, such as PDFs, for use outside of Perlego. However, you can download books within the Perlego app for offline reading on mobile or tablet. Learn how to download books offline
Perlego offers two plans: Essential and Complete
Essential is ideal for learners and professionals who enjoy exploring a wide range of subjects. Access the Essential Library with 800,000+ trusted titles and best-sellers across business, personal growth, and the humanities. Includes unlimited reading time and Standard Read Aloud voice.
Complete: Perfect for advanced learners and researchers needing full, unrestricted access. Unlock 1.5M+ books across hundreds of subjects, including academic and specialized titles. The Complete Plan also includes advanced features like Premium Read Aloud and Research Assistant.
Both plans are available with monthly, semester, or annual billing cycles.
We are an online textbook subscription service, where you can get access to an entire online library for less than the price of a single book per month. With over 1.5 million books across 990+ topics, we’ve got you covered! Learn about our mission
Look out for the read-aloud symbol on your next book to see if you can listen to it. The read-aloud tool reads text aloud for you, highlighting the text as it is being read. You can pause it, speed it up and slow it down. Learn more about Read Aloud
Yes! You can use the Perlego app on both iOS and Android devices to read anytime, anywhere — even offline. Perfect for commutes or when you’re on the go. Please note we cannot support devices running on iOS 13 and Android 7 or earlier. Learn more about using the app
Yes, you can access The Water Footprint of Modern Consumer Society by Arjen Y. Hoekstra in PDF and/or ePUB format, as well as other popular books in Economics & Business General. We have over 1.5 million books available in our catalogue for you to explore.