
eBook - ePub
Carbon-Neutral Architectural Design
Pablo M. La Roche
This is a test
Share book
- 466 pages
- English
- ePUB (mobile friendly)
- Available on iOS & Android
eBook - ePub
Carbon-Neutral Architectural Design
Pablo M. La Roche
Book details
Book preview
Table of contents
Citations
About This Book
The energy used to operate buildings is one of the most significant sources of greenhouse gas emissions. While it is possible to reduce emissions through climate-responsive design, many architects are not trained to do this. Filling an urgent need for a design reference in this emerging field, this book describes how to reduce building-related greenhouse gas emissions through appropriate design techniques. It presents strategies to achieve CO2 reductions, with an emphasis on control of energy flows through the building envelope and passive heating and cooling strategies. This new, revised edition is updated throughout, and includes a new chapter on building simulations.
Frequently asked questions
How do I cancel my subscription?
Can/how do I download books?
At the moment all of our mobile-responsive ePub books are available to download via the app. Most of our PDFs are also available to download and we're working on making the final remaining ones downloadable now. Learn more here.
What is the difference between the pricing plans?
Both plans give you full access to the library and all of Perlego’s features. The only differences are the price and subscription period: With the annual plan you’ll save around 30% compared to 12 months on the monthly plan.
What is Perlego?
We are an online textbook subscription service, where you can get access to an entire online library for less than the price of a single book per month. With over 1 million books across 1000+ topics, we’ve got you covered! Learn more here.
Do you support text-to-speech?
Look out for the read-aloud symbol on your next book to see if you can listen to it. The read-aloud tool reads text aloud for you, highlighting the text as it is being read. You can pause it, speed it up and slow it down. Learn more here.
Is Carbon-Neutral Architectural Design an online PDF/ePUB?
Yes, you can access Carbon-Neutral Architectural Design by Pablo M. La Roche in PDF and/or ePUB format, as well as other popular books in Ciencias biológicas & Conservación y Protección del Medio Ambiente. We have over one million books available in our catalogue for you to explore.
Information
1 | Buildings and Climate Change |
1.1 THE GREENHOUSE EFFECT
The greenhouse effect occurs when radiation from the sun passes through the atmosphere and hits the surface of the Earth, which then absorbs it, heats up, and emits infrared radiation. Greenhouse gases (GHGs) in the atmosphere absorb most of this infrared radiation and then radiate in the infrared range, which is emitted upward and downward, with part of it absorbed by other atmospheric gases further raising their temperature, part of it escaping to space, and another part reflected downward toward the Earth’s surface (Figure 1.1). The surface and lower atmosphere are warmed by the part of the energy that is radiated downward, making our life on the Earth possible. Without the greenhouse effect, the Earth’s temperature would be too cold for life to exist.
Some GHGs occur naturally and are discharged to the atmosphere through natural processes and human activities, whereas other GHGs are created and emitted only through human activities. The main GHGs that enter the atmosphere as a product of human activities are carbon dioxide (CO2), methane (CH4), nitrous oxide (N2O), hydroflourocarbon gases, and sulfur hexafluoride.
Most of the carbon dioxide that enters the atmosphere is a result of the burning of fossil fuels (oil, natural gas, and coal), solid waste, trees, and wood products, and other chemical reactions (e.g., manufacture of cement). Carbon dioxide is removed from the atmosphere, or “sequestered,” when it is absorbed by plants as part of the biological carbon cycle. Methane is given off during the production and transport of coal, natural gas, and oil, from livestock and other agricultural practices, and by the decay of organic waste in municipal solid waste landfills. Nitrous oxide is emitted during agricultural and industrial activities as well as during the combustion of fossil fuels and solid waste. Fluorinated gases such as hydrofluorocarbons, perfluorocarbons, and sulfur hexafluoride are synthetic gases that are generated from a variety of industrial processes and sometimes used as substitutes for ozone-depleting substances. Water vapor is not a man-made GHG and is usually not considered a cause of man-made global warming because it does not persist in the atmosphere for more than a few days.
The concept of global warming potential (GWP) describes in one number the different capacities to affect climate change. The GWP is defined as the warming influence over a set time period of a gas relative to that of carbon dioxide, which under the Kyoto protocol is a 100-year time period. The GWP of the gases previously described is indicated in Table 1.1. Even though other gases have a much higher GWP, CO2 is the most prevalent GHG and is the most commonly mentioned, sometimes inappropriately.
Another unit used to measure the impact of these gases in one single standard unit is the carbon dioxide equivalent (CO2e), which also rates these gases based on their 100-year GWP, providing a way to compare emissions from different sources using a common unit of measurement (1 kg CO2e = 1 kg CO2). The standard unit is MtCO2e or metric tons of carbon dioxide equivalent. The global warming impact of all GHGs is measured in terms of equivalency to the impact of carbon dioxide (CO2) via GWPs. The United Nations Environment Programme (UNEP) proposes CO2e as the common carbon metric for international use in the gathering of data and reporting of the climate performance of existing buildings to (1) support policies under development to reduce GHG emissions from buildings, (2) provide a framework to measure emission reductions in buildings, and (3) establish a system with measurable reportable and verifiable indicators (UNEP SBCI, 2010). CO2e is the unit of GHG measurement used throughout this book.
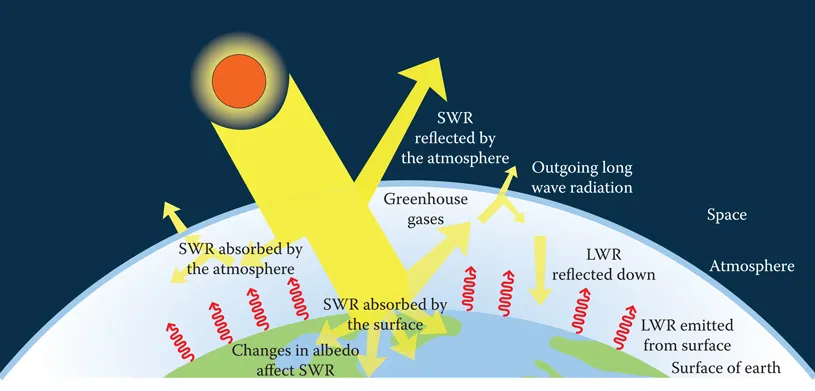
FIGURE 1.1 The greenhouse effect.
TABLE 1.1
GWPs of Several Common Anthropogenic GHGs
GWPs of Several Common Anthropogenic GHGs
Greenhouse Gas | GWP |
Carbon dioxide (CO2) | 1 |
Methane (CH4) | 21 |
Nitrous oxide (N2O) | 310 |
Hydrofluorocarbon gases | 6,500 |
Sulfur hexafluoride | 23,900 |
A global assessment of data since 1970 has demonstrated that “it is likely that anthropogenic warming has had a discernible influence on many physical and biological systems” (IPCC, 2007; Parry et al. 2007). Average global surface temperatures have increased by 0.74°C over the past 100 years, and much of the observed rise in sea level (12–22 cm) during the twentieth century is probably related to this increase in global mean temperatures.
1.2 EFFECTS OF ANTHROPOGENIC EMISSIONS ON CLIMATE CHANGE
Life on the Earth would not be possible if not for the greenhouse effect; however, an increase in the concentration of anthropogenic GHGs, especially CO2, is affecting climate. The current Intergovernmental Panel on Climate Change (IPCC) climate models also predict that global temperatures will rise by an additional 1.1°C–6.4°C by the end of the twenty-first century, depending on the amount of emissions and how the different variables interrelate as climate changes over time. Global mean sea levels are also predicted to rise by 20–60 cm by 2100. Sea-level rise threatens coastal communities, whereas higher temperatures, drought, and flooding will affect people’s health and way of life, causing the irreversible loss of many species of plants and animals. There is no doubt that climate change is the most serious environmental threat facing the planet. Along with warming at the Earth’s surface, more extreme weather events are becoming more common. Heat waves have become more frequent and are lasting longer. The height of extreme sea levels caused by storms has increased. Warming is expected to cause more intense, heavy rainfall events.
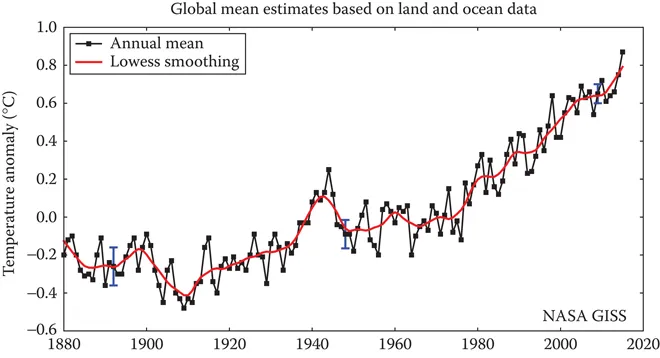
FIGURE 1.2 Hemispheric temperature change. (Courtesy of NASA Goddard Institute for Space Studies, New York.)
Except for a leveling off between the 1940s and the 1970s, the surface temperature of the Earth has steadily increased since 1880, and since the 1990s, it has increased at a faster rate in the northern hemisphere than in the southern hemisphere. The highest values ever recorded in both hemispheres have been reached in this decade (2000–2015). The current data from the National Aeronautics and Space Administration (NASA) Earth observatory (Figure 1.2) shows how the five-year running average continues to increase, especially after 1980. A warming of the climate system is unequivocal, and since the 1950s, many of the observed changes have been unprecedented over decades to millennia.
The IPCC’s Fifth Assessment Report (2013) concluded that the scientific evidence for a warming climate is undeniable and that “human influence on the climate system is clear.” Each of the last three decades has been successively warmer at the Earth’s surface than any preceding decade since 1850 (see Figure 1.3), and the period 1983–2012 was likely the warmest 30-year period of the past 1400 years (medium confidence). The globally averaged combined land and ocean surface temperature data as calculated by a linear trend show a warming of 0.85°C (0.65°C–1.06°C), over the period 1880–2012, when multiple independently produced datasets exist.
The evidence for human influence has grown since 4th Assessment Report (AR4). The IPCC states (2013) that “it is extremely likely that human influence has been the dominant cause of the observed warming since the mid twentieth century.” Figure 1.4 compares the observed and simulated climate changes based on three large-scale indicators in the atmosphere, the cryosphere, and the ocean: change in continental land surface air temperatures (yellow panels), Arctic and Antarctic September sea ice extent (white panels), and upper ocean heat content in the major ocean basins (blue panels). Global average changes are also given. Anomalies are given relative to 1880–1919 for surface temperatures, 1960–1980 for ocean heat content, and 1979–1999 for sea ice. All time series are decadal averages, plotted at the center of the decade. For temperature panels, observations are dashed lines if the spatial coverage of areas being examined is <50%. For ocean heat content and sea ice panels, the solid line is where the coverage of data is good and higher in quality, and the dashed line is where the data coverage is only adequate, and thus, uncertainty is larger (Figure 1.5).
The effects can be seen over ocean, land, and ice. Observations of climate changes from AR4 include warming throughout much of the world’s oceans, increasing rates of global mean sea-level rise, changes in ocean salinity, acidification of the oceans, more frequent warm days and nights and fewer cold days and nights, reductions in the number of frost days, decreasing snow cover in most regions, degrading permafrost in extent and thickness, large-scale precipitation changes, increase in the number of heavy precipitation events, shrinking annual average Artic sea ice extent, widespread glacier retreat, and changes in ice sheets in Greenland and Antarctica. These are all discussed in great detail in 5th Assessment Report (AR5) (IPCC, 2013).
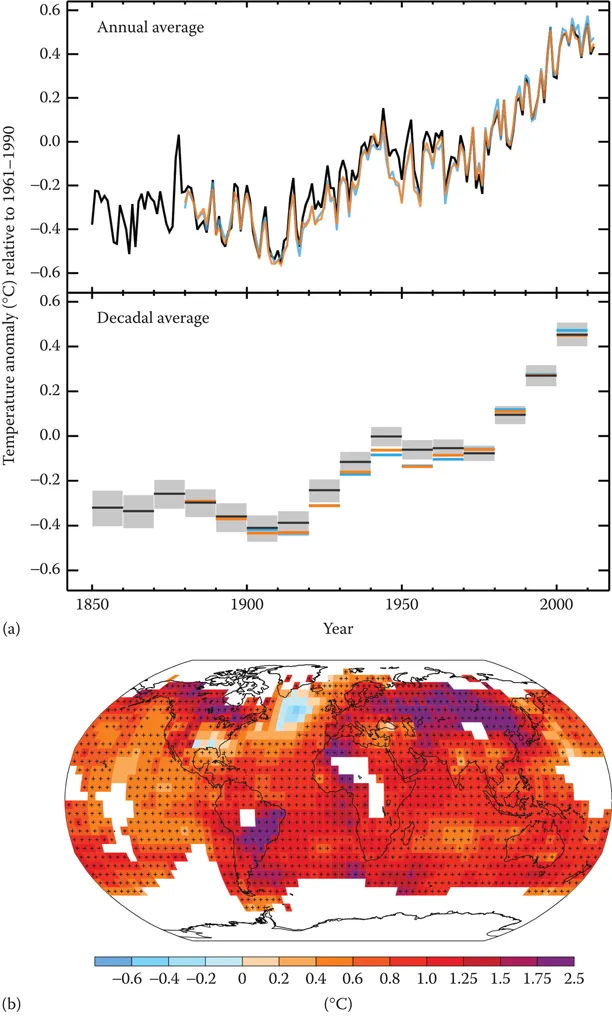
FIGURE 1.3 Observed changes in surface temperature: (a) observed globally averaged combined land and ocean surface temperature anomaly (1850–2012) and (b) observed change in surface temperature (1901–2012). (From IPCC, Climate change 2014: Impacts, adaptation, and vulnerability, In: Working Group II Contribution to the Fifth Assessment Report of the Intergovernmental Panel on Climate Change, Retrieved from http://www.ipcc.ch/pdf/assessment-report/ar5/wg2/ar5_wgII_spm_en.pdf, 2014.)
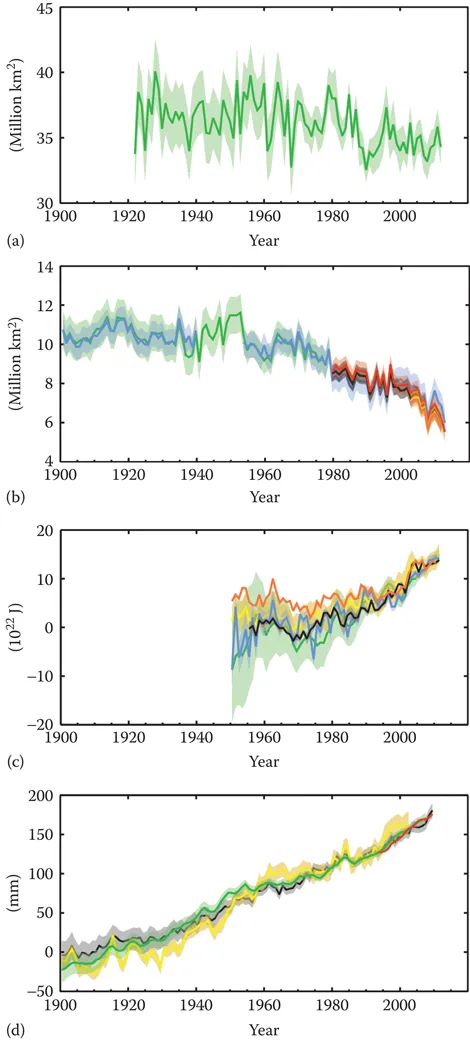
FIGURE 1.4 Climate change indicators: (a) northern hemisphere spring snow cover, (b) Arctic summer sea ice extend, (c) change in global average upper ocean heat content, and (d) global average sea-level change. (From IPCC, Summary for policymakers, In: Climate Change 2013: The Physical Science Basis. Contribution of Working Group I to the Fifth Assessment Report of the Intergovernmental Panel on Climate Change, Stocker, T.F., D. Qin, G.-K. Plattner, M. Tignor, S.K. Allen, J. Boschung, A. Nauels, Y. Xia, V. Bex, and P.M. Midgley, (eds.), Cambridge, Cambridge University Press, pp. 1–30. Retrieved February 10, 2016, from http://www.ipcc.ch/pdf/assessment-report/ar5/wg1/WG1AR5_SPM_FINAL.pdf, 2013.)
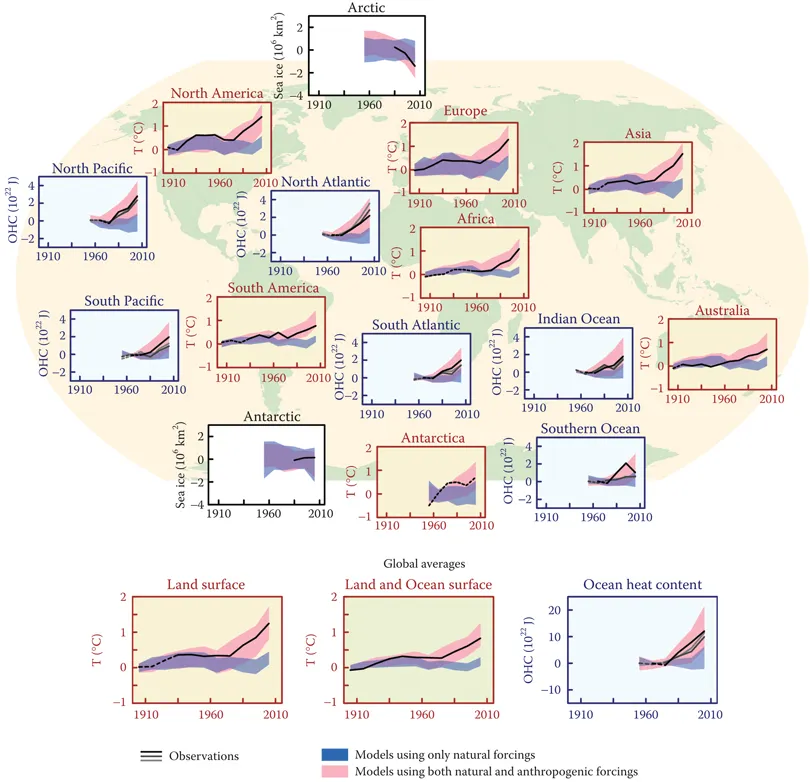
FIGURE 1.5 Hemispheric temperature change. (From IP...