Introduction to Data Science
Data Analysis and Prediction Algorithms with R
Rafael A. Irizarry
- 713 pages
- English
- ePUB (mobile friendly)
- Available on iOS & Android
Introduction to Data Science
Data Analysis and Prediction Algorithms with R
Rafael A. Irizarry
About This Book
Introduction to Data Science: Data Analysis and Prediction Algorithms with R introduces concepts and skills that can help you tackle real-world data analysis challenges. It covers concepts from probability, statistical inference, linear regression, and machine learning. It also helps you develop skills such as R programming, data wrangling, data visualization, predictive algorithm building, file organization with UNIX/Linux shell, version control with Git and GitHub, and reproducible document preparation.
This book is a textbook for a first course in data science. No previous knowledge of R is necessary, although some experience with programming may be helpful. The book is divided into six parts: R, data visualization, statistics with R, data wrangling, machine learning, and productivity tools. Each part has several chapters meant to be presented as one lecture.
The author uses motivating case studies that realistically mimic a data scientist's experience. He starts by asking specific questions and answers these through data analysis so concepts are learned as a means to answering the questions. Examples of the case studies included are: US murder rates by state, self-reported student heights, trends in world health and economics, the impact of vaccines on infectious disease rates, the financial crisis of 2007-2008, election forecasting, building a baseball team, image processing of hand-written digits, and movie recommendation systems.
The statistical concepts used to answer the case study questions are only briefly introduced, so complementing with a probability and statistics textbook is highly recommended for in-depth understanding of these concepts. If you read and understand the chapters and complete the exercises, you will be prepared to learn the more advanced concepts and skills needed to become an expert.
A complete solutions manual is available to registered instructors who require the text for a course.
Frequently asked questions
Information
1
Getting started with R and RStudio
1.1 Why R?
- R is free and open source2.
- It runs on all major platforms: Windows, Mac Os, UNIX/Linux.
- Scripts and data objects can be shared seamlessly across platforms.
- There is a large, growing, and active community of R users and, as a result, there are numerous resources for learning and asking questions3 4 5.
- It is easy for others to contribute add-ons which enables developers to share software implementations of new data science methodologies. This gives R users early access to the latest methods and to tools which are developed for a wide variety of disciplines, including ecology, molecular biology, social sciences, and geography, just to name a few examples.
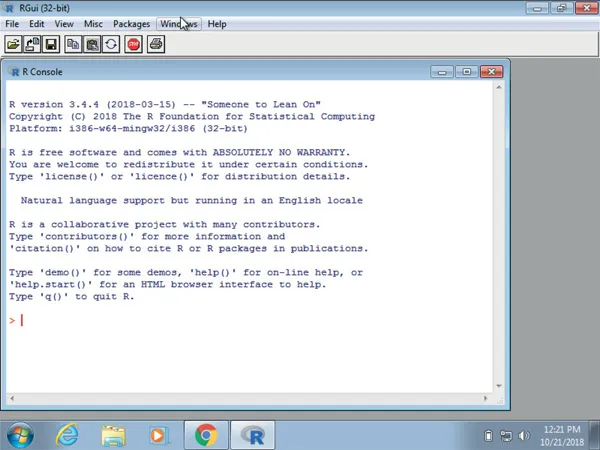
1.2 The R console
#> [1] 2.96
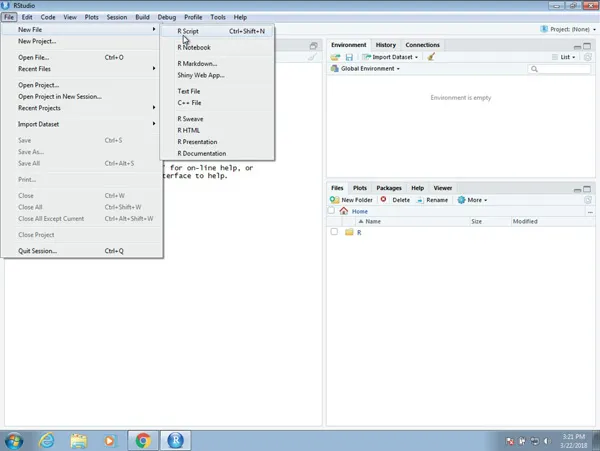
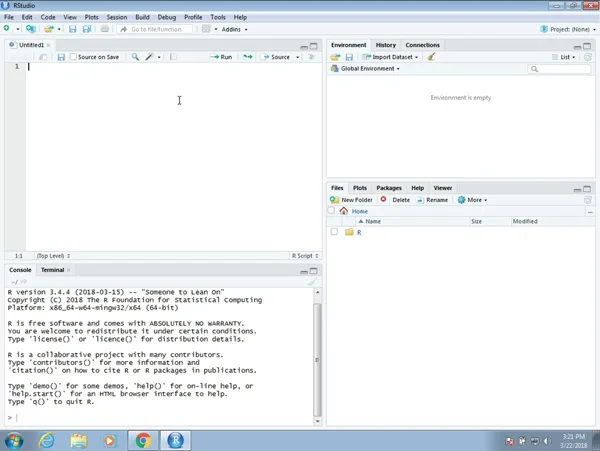
1.3 Scripts
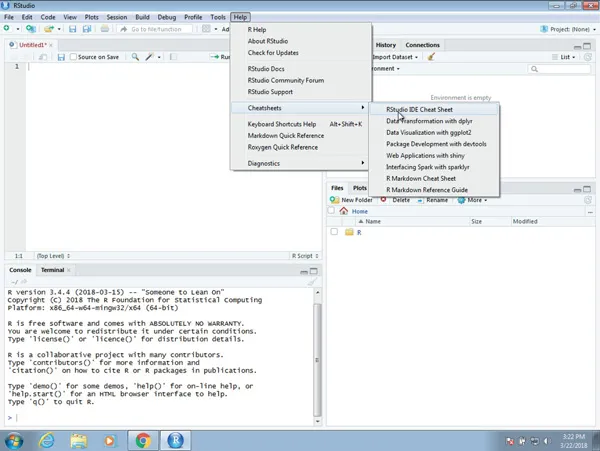
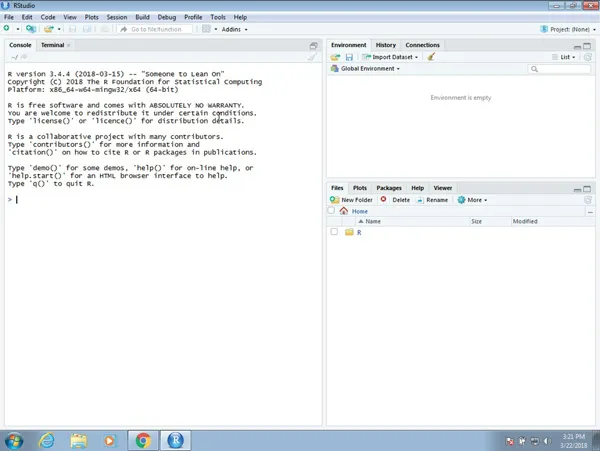
1.4 RStudio
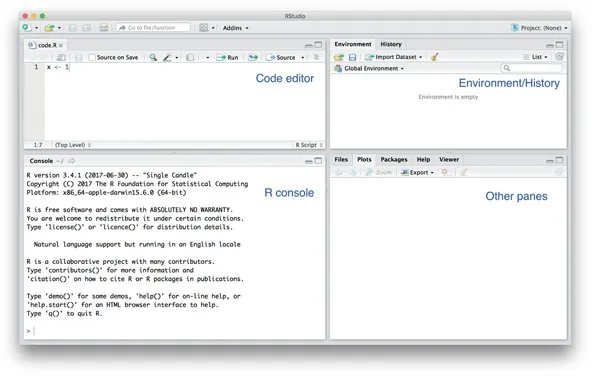
1.4.1 The panes
1.4.2 Key bindings