Following on from the highly successful first edition, published in 2006, the second edition of Basic Orthopaedic Sciences has been fully updated and revised, with every chapter rewritten to reflect the latest research and practice. The book encompasses all aspects of musculoskeletal basic sciences that are relevant to the practice of orthopaedics and that are featured and assessed in higher specialty exams. While its emphasis is on revision, the book contains enough information to serve as a concise textbook, making it an invaluable guide for all trainees in orthopaedics and trauma preparing for the FRCS (Tr & Orth) as well as for surgeons at MRCS level, and other clinicians seeking an authoritative guide.
The book helps the reader understand the science that underpins the clinical practice of orthopaedics, an often neglected area in orthopaedic training, achieving a balance between readability and comprehensive detail. Topics covered include biomechanics, biomaterials, cell & microbiology, histology, structure & function, immunology, pharmacology, statistics, physics of imaging techniques, and kinesiology.

- 524 pages
- English
- ePUB (mobile friendly)
- Available on iOS & Android
eBook - ePub
Basic Orthopaedic Sciences
About this book
Trusted by 375,005 students
Access to over 1.5 million titles for a fair monthly price.
Study more efficiently using our study tools.
1 | Statistics |
Introduction
Data type
Data presentation
Data interpretation
Significance testing
Data collection
Outcome measures
Survival analysis
Viva questions
Further reading
Introduction
A working knowledge of statistics is essential for any healthcare professional working within the sphere of orthopaedics. At its most basic, statistics involves the handling of data, best thought of in three ways:
• Data collection, e.g. surveys.
• Data presentation, e.g. graphs, tables.
• Data interpretation, e.g. hypothesis testing, confidence intervals.
In well-designed studies, statisticians work in conjunction with orthopaedic surgeons from the outset, to maximize the methodological and statistical strength of a research study. All orthopaedic surgeons should have an awareness of the principles of study design, and be able to interpret the results of a study objectively.
Data type
Types of data are summarized in Table 1.1.
Table 1.1 Data types
 | ||
Nominal | Categories without order, e.g. eye colour | Non-parametric |
Binomial | 2 possible outcomes, e.g.dead/alive, success/failure, heads/tails | Non-parametric |
Ordinal | Categories with order, e.g. small/medium/large | Non-parametric |
Integer | Ordered scale of whole numbers (no fractions or divisions), e.g. screw lengths (22 mm, 24 mm, 26 mm…) | Non-parametric or parametric |
Interval | Ordered numerical measurement with subdivisions, e.g. height, weight, volume | Parametric |
Data presentation
Plotting of data allows determination of central tendency and spread (or variability/variance). The familiar symmetrical bell-shaped curve of a normal (or Gaussian) distribution (Figure 1.1a) allows for the use of the mean as a measure of central tendency and is common throughout medicine.
Bell-shaped curves, when asymmetrical, are not distributed normally. A skewed distribution is asymmetrical and has a tail, which is either positive or negative. If data distribution is skewed, then the median or mode has to be used to measure central tendency. By assuming that the mode of the distribution represents the ‘zero point’, then positive skews have the long tail on the positive side, and negative skews have the long tail on the negative side. If there is doubt about the normality of a distribution, then it is best to assume that any given distribution is not normal. The easiest examples of skewed distributions concern age, i.e. positive skew – age at which anterior cruciate ligament (ACL) surgery occurs; negative skew – age at which total hip replacement (THR) surgery occurs.
Transformation is the method by which non-normal data can be mathematically normalized in order to allow parametric testing. This is most commonly achieved using logarithmic transformations.
Measures of central tendency
• Mean: the average of the data, measured by dividing the sum of all the observations by the number of observations.
• Median: the central value of the data; used for ordinal data.
• Mode: the data value with the most frequency; used for nominal data.
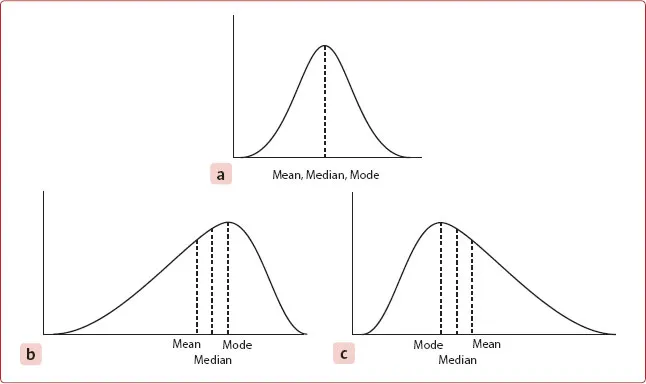
Figure 1.1 Mean, median and modes for different data spreads. (a) normal distribution (b) negative skew (c) positive skew.
For perfectly normally distributed data, the mean, median and mode are the same. This does not hold true for skewed data (Figure 1.1b,c). In skewed distributions the median (i.e. middle) is always in between the mode and mean on a graph.
Measures of spread/variability
• Range: the lowest and highest values of the data. The range does not give much information about the spread of the data about the mean.
• Percentiles: groupings of data into brackets. Commonly this is groupings of 25% (known as quartiles), from which the interquartile range can be calculated.
• Variance: the measure of the spread where the mean is the measure of the central tendency. Variance is the corrected sum of squares about the mean [σ (x − mean)2 / (n − 1)].
• Standard deviation (⌧): the square root of the variance (the use of the square root gives the same dimension as the data). For reasonably symmetrical bell-shaped data, one standard deviation (SD) contains roughly 68% of the data, two SD contains roughly 95% of the data and three SD contains around 99.7% of the data (Figure 1.2). A normal distribution is defined uniquely by two parameters, the mean and the SD of the population. Other features of a normal distribution include that it is symmetrical (mean = mode = median) and that the data are continuous.
• Standard error (SE) of the mean: defined as the SD divided by the square root of the sample size. Used in relation to a sample rather than the population as a whole. It can be thought of as being equivalent to the SD for the true mean, i.e. 68% confidence that the population mean lies within one SE of the calculated (sample) mean, 95% confidence that population mean lies within two SEs of the sample mean, 99.7% for three SEs. The formula does not assume a normal distribution.
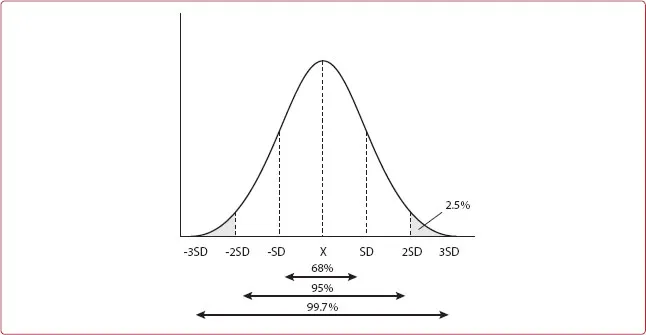
Figure 1.2 Standard deviations (SDs) of normally distributed data.
• Confidence interval (CI): two SEs either side of the sample mean determines the 95% CI of the mean (i.e. we are confident that the true population mean lies within this range of values). Confidence intervals are preferred to P values (see below) because:
• CIs relate to the sample size;
• a range of values is provided;
• CIs provide a rapid visual impression of significance;
• CIs have the same units as the variable.
Data interpretation
All good studies test hypotheses. When statistics are used to examine data concerning hypotheses, the key concept is that of the null hypothesis, where a primary assumption is made that any difference seen occurred purely by chance. The collected data are then tested to disprove the null hypothesis; if the result is statistically significant, then the hypothesis is rejected on the basis that it is wrong. The difference, therefore, must be real and did not occur by chance.
It is possible to calculate the probability that any difference seen did occur by chance. Orthopaedic surgeons are usually willing to accept a 5% probability that the difference seen was due to chance (P = 0.05). If P is less than 0.05, then this suggests that the probability of the difference seen being due to chance is less than 5% (for P <0.001, the probability is less than 0.1%).
Errors
Errors may arise when accepting or rejecting the null hypothesis. A type I (α) error occurs when a difference is found, but in reality there is not a difference (i.e. a false-positive result, and therefore the null hypothesis is rejected incorrectly). This is one of those 5% of cases where the differ...
Table of contents
- Cover
- Half Title
- Title Page
- Copyright Page
- Dedication
- Table of Contents
- Contributors
- Preface to Second Edition
- Preface to First Edition
- Foreword to First Edition
- Acknowledgements in the First Edition
- Abbreviations
- 1 Statistics
- 2 Genetics
- 3 Skeletal Embryology and limb growth
- 4 Orthopaedic Pharmacology
- 5 Inflammation and Infection
- 6 Imaging Techniques
- 7 Orthopaedic Oncology
- 8 Ligament and Tendon
- 9 Meniscus
- 10 Articular Cartilage
- 11 Nerve
- 12 Skeletal Muscle
- 13 Basics of Bone
- 14 Bone Injury, Healing and Grafting
- 15 Intervertebral Disc
- 16 Basic Concepts in Biomechanics
- 17 Biomaterial Behaviour
- 18 Biomaterials
- 19 Biomechanics and Joint Replacement of the Hip
- 20 Biomechanics and Joint Replacement of the Knee
- 21 Biomechanics of the Spine
- 22 Biomechanics and Joint Replacement of the Shoulder and Elbow
- 23 Biomechanics of the Hand and Wrist
- 24 Biomechanics and Joint Replacement of the Foot and Ankle
- 25 Friction, Lubrication, Wear and Corrosion
- 26 Gait
- 27 Prosthetics
- 28 Orthotics
- 29 Inside the Operating Theatre
- 30 Basic Science of Osteoarthritis
- 31 Biomechanics of Fracture Fixation
- Appendix
- Index
Frequently asked questions
Yes, you can cancel anytime from the Subscription tab in your account settings on the Perlego website. Your subscription will stay active until the end of your current billing period. Learn how to cancel your subscription
No, books cannot be downloaded as external files, such as PDFs, for use outside of Perlego. However, you can download books within the Perlego app for offline reading on mobile or tablet. Learn how to download books offline
We are an online textbook subscription service, where you can get access to an entire online library for less than the price of a single book per month. With over 1.5 million books across 990+ topics, we’ve got you covered! Learn about our mission
Look out for the read-aloud symbol on your next book to see if you can listen to it. The read-aloud tool reads text aloud for you, highlighting the text as it is being read. You can pause it, speed it up and slow it down. Learn more about Read Aloud
Yes! You can use the Perlego app on both iOS and Android devices to read anytime, anywhere — even offline. Perfect for commutes or when you’re on the go.
Please note we cannot support devices running on iOS 13 and Android 7 or earlier. Learn more about using the app
Please note we cannot support devices running on iOS 13 and Android 7 or earlier. Learn more about using the app
Yes, you can access Basic Orthopaedic Sciences by Manoj Ramachandran in PDF and/or ePUB format, as well as other popular books in Medicine & Anatomy. We have over 1.5 million books available in our catalogue for you to explore.